Concrete Block Tracking in Breakwater
Models
by Fernando SOARES, Maria João HENRIQUES and César ROCHA,
Portugal
 |
 |
 |
| Fernando SOARES |
Maria JoãoHENRIQUES |
César ROCHA |
1)
This paper was presented at the FIG Working Week 2017 in Helsinki,
Finland, 29 May – 2 June. This paper focuses on breakwater(BW) and
evaluate the effectiveness of the shape and of the protective elements
to save the harbour. This study proposes a methodology to estimate
displacements of concrete blocks of the outer layer, also called
protection layer, of rouble-mound breakwater models.
SUMMARY
The protection of harbours in coastal areas, that are exposed to the
action of the sea waves, is made by breakwaters. During the phase of
design of new breakwaters or the rehabilitation of existing ones, the
evaluation of effectiveness of the shape and of the protective elements
to save the harbour, 3D scale models are built inside wave basins or
wave flumes. In the testing phase, water waves are generated, and the
resulting impact on the breakwater model is periodically evaluated to
study the hydraulic and structural behaviour under predefined sea-wave
conditions. This study proposes a methodology to estimate displacements
of concrete blocks of the outer layer, also called protection layer, of
rouble-mound breakwater models. These blocks are placed in the areas
where it is expected that action of the waves is stronger. The
combination between the 3D information of a point cloud survey and the
visual information of a digital image is a key factor for estimate the
spatial location of the geometric centre of the blocks. The location of
a block centre point, at different instants, gives its spatial
displacement. The equipment used for data acquisition tests were a
Kinect V2 sensor and a digital camera, with which were obtained the main
data sets for this work: RGB imagery and 3D Point Clouds. The data
collected by this allowed the generation of point clouds (X, Y and Z)
and orthomosaics, both fundamental for the determination of
displacements of the blocks. Indeed, displacements detection results
from the determination of the spatial coordinates of the several
locations of the Geometric Centre of each block, which is in fact the
main outcome of this study. It is expected to serve as a contribution to
the laboratory teams working at the Harbours and Maritime Structures
Division of the Department of Hydraulics and Environment.
1.INTRODUCTION
A breakwater (BW) is a coastal engineering structure that has as main
purpose the protection of a harbour against sea waves, although it is
also used as coastal protection structure. A rubble‑mound BW, the most
common harbour protection structure in areas with severe wave regimes,
has large stones and/or special concrete blocks (cube, tetrapod or
others) in the protection layer, the one that is exposed to the action
of the waves. Displacements of the blocks can lead to a weakness of the
protection and causing the harbour to become more the influence of
waves.
During the phase of project is important to design an adequate
structure: strong enough to resist to harsh wave regimes but with a cost
of construction and maintenance reasonable. During this phase, after a preliminary design, the performance of the BW is verified with a
physical model to evaluate the design effectiveness (Reis et al., 2014).
Although there is software developed to evaluate the hydraulic and
structural behaviour of this structures it was proven that tests with
physical models and water are still more representative of the
performance of structures in real environments.
The Harbours and
Maritime Structures Division of the Department of Hydraulics and
Environment (NPE) of Laboratório Nacional de Engenharia Civil (LNEC)
frequently uses physical models of BWs, build inside water basins
(complete model) or wave flumes (a section of the model) to study if the
structure fulfils the safety requirements. Several sea states are
reproduced and the effects of the waves on the structure are studied.
During the study of the ripple effect on the model, waves are generated
for periods of, usually, 20 minutes followed by a stationary period,
during which information about the structure is gathered. During the
study is intended to detect areas where the model changes due to the
action of the waves. The most effective method of detection would be by
measuring the displacement of the protective blocks. For the civil
engineer, who will analyse the information, will be enough to only know
the position of the centre of each of the protective blocks to be able
to determine, by comparing data from different "campaigns", the
displacement of each block.
This paper presents a methodology for the
determination of displacements of the centre of tetrapods, a common
protection block used for the protection of many BW, based on data
acquired by a digital camera and by a sensor Kinetic V2 e.
1.1 Motivation
There is large interest in detecting changes of models of BWs,
quickly, accurately and economically:
- Quickly, to reduce
the periods in which the model is "stopped".
- Accurate, to have
confidence in the data that is obtained.
- Economic, to manage
and use, as much as possible, the available resources of the
institution.
There have been attempts to achieve a proper method, three
of those engaged at NPE. One took advantage of the traditional methods
of photogrammetry, for which it was necessary to obtain images in the
vertical of the model, which proved very time-consuming when used in
water basins because it involved the assembly/disassembly of a structure
for mounting the cameras; the other two included the study of the
component "colour" of the images. In this last approach, difficulties
were experienced due to lighting, which was impossible to maintain
constant during the days/weeks in which the tests took place. Being a
still unsolved problem, it was considered of interest to apply a totally
different method that was based on coordinates of points obtained from
point clouds generated from conventional photographs, obtained by
digital cameras.
1.2 Framework
The theme “motion detection in BWs” requires an approach in two
complementary steps. The first relates to the generation of orthomosaics
and point clouds, including the choice of the best methodologies of
image acquisition. The second relates to the ability to detect and
locate each object (tetrapod, cube, that is, a block that has regular
shape and known dimensions) lying on the surface of BWs, and determine
the coordinates of the centres of this blocks with data extracted from
the orthomosaics and from de point clouds.
The knowledge acquired and the procedures developed by the authors of
this paper will be transferred to the technical LNEC personnel
accompanying the tests of the design of BWs. The methodology is likely
to have a higher value because it may be applied in real scenario BWs,
located on the Portuguese coast.
2. OBJECTIVE
This study presents an approach to perform block tracking in physical
BW models by using both registered Point Cloud (PC) and RGB imagery data
taken at different instants. At a given instant, the status of each
block is given by both location and orientation parameters. The 3D
coordinates (XO,YO,ZO) of its Geometric Centre (GC), at consecutive
instants, are used to obtain a motion path of each block. Angular
parameters describe how blocks are moving, whether if rolling, or
spinning, and can be designated as “Orientation”. In this study, we have
focused the efforts on developing a method to find the location of the
GC of the blocks, as it was put as a priority task by the working team.
3. EXPERIMENT SETUP
The data sets of the present study are the result of two different
campaigns of breakwater models monitoring, each one using a different
acquisition system. Both campaigns carried out in the facilities of the
LNEC.
The aim of the laboratory experiments is to study the motion
behaviour of BW models when struck by artificially generated water
waves. The BW model is built of concrete blocks with known geometry and
scales of weight and size.
The physical event is monitored by a camera system. The incoming
datasets, obtained either directly or indirectly, were of two different
kinds: RGB imagery and distance Point Cloud (PC). The next sections
describe in more detail the acquisition devices and the data sets
obtained.
3.1 Main data set 1
The data used on this experiment, kindly supplied by LNEC, were
obtained on the scope of a scientific study about point cloud
acquisition, developed by Henriques et al (2015), and presented at the
FIG Working Week 2015. In summary, traditional photogrammetric and
photographic techniques were followed to obtain two RGB ortho-images an
PC data sets of the BW model. The surveyed area is described in Table 1
by the correspondent coordinate limits for all products.
Table 1. Experiment 1: RGB and PC metadata
| Main Data |
Rows |
Columns |
X min |
X max |
Y min |
Y max |
Z min |
Z max |
| RGB 1 |
2112 |
5152 |
-0.3920 |
1.2821 |
-0.0055 |
0.6805 |
24 bit image |
| RGB 2 |
2922 |
5446 |
-0.4049 |
1.3647 |
-0.0146 |
0.9347 |
24 bit image |
| PC 1 |
Text file |
-0.3920 |
1.2584 |
-0.0052 |
0.6805 |
-0.0185 |
0.2915 |
| PC 2 |
Text file |
-0.4049 |
1.2246 |
-0.0143 |
0.9256 |
-0.0153 |
0.3366 |
The blocks of concrete of the physical BW model are
cubes (Fig. 1a), with an edge length of 32 mm (Fig. 2a).
More detailed
information about all the technical characteristics of the produced data
sets can be found at the previous reference, Section 4 (“The Model of a
Breakwater”).
3.2 Main data set 2
This case study was the result
of a single laboratory campaign made in the scope of a Master Thesis
(Rocha, 2016), aiming to test a new methodology of BW models monitoring.
The experience was made also in LNEC, on a BW model built with tetrapod
units on the protection layer (Fig. 1b). Those units, more complex, have
four circular plane faces of 5 mm radius (R), each one spaced 30.4 mm
from the correspondent GC (Fig. 2b). The BW model was 3D scanned and
photographed in simultaneous with a Kinect V2 RGB-D device, assembled on
an elevated platform, at about 1.5 m vertically distant from the
protection layer. A laptop Intel Core I5, 3.0GHz, USB 3.0, connected to
the Kinect V2, stored distance data (PC) and imagery data, both at a
rate of 1 frame per second.
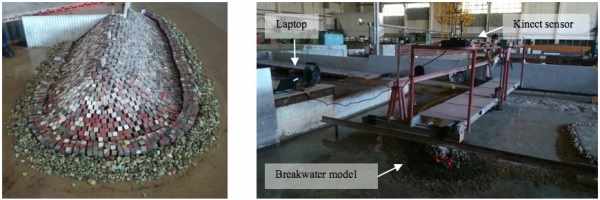
Figure 1. (a) Left image: Experiment 1. (b) Right image: Experiment
2.
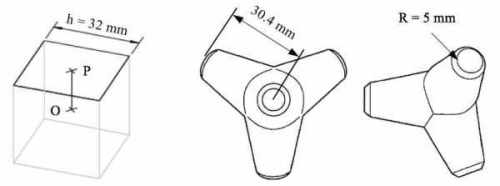
Figure 2. Blocks of concrete models.
(a) Left illustration: cube. (b) Middle and right illustrations:
tetrapod
3.2.1 About the Kinect V2 device
This device is the latest version of a motion detection sensor,
created by Microsoft ®, for gaming interaction purposes.
The Kinect V2 sensor integrates a 1920×1080-pixel resolution RGB
camera, for imagery data acquisition, and a 512×424-pixel resolution
Infrared Sensor (IR) with infrared illuminators, for distance
measurement. For each pixel of the depth matrix, the measuring device
estimates in real-time a distance value to the corresponding object
point. From the created “depth map”, and after a few post-processing
steps, it is then possible to obtain indirectly PC of the captured scene
or object. A complete description of this sensor and features can be
found at Lachat et al. (2015).
The data acquired by the Kinetic is immediately transferred to a
computer (it has no register capacity). The data transferring requires a
Windows 8/10 compliant computer with a 64-bit (x64) processor, a
built-in USB 3.0 host controller and a DX11 capable graphics adapter.
Also, a power hub and USB cabling for the Kinect V2 device is required.
4. BLOCK TRACKING METHODOLOGY
The measured 3D points of a PC are generated only
on the visual exposed regions of the BW model. The identification,
either visual or by any other method, of the location and geometric
shape of the block units, in a 3D PC, is a difficult task to accomplish
(Henriques et al, 2016). The narrow gaps between neighbouring block
units are frequently non-sampled, transforming several blocks in a
unique block (Fig. 3). In addition, along the exposed flat faces of
blocks, fluctuations in the measured distances (Z) occur, turning block
edge identification a difficult task to achieve. To give answer to these
drawbacks, we propose to use registered RGB images to best define the
geometry of a block unit, by manual segmentation of a binary mask, then
estimate an optimal plane surface, by least squares adjustment, that
best fits the correspondent 3D points group. The RGB sample data sets
were obtained from regions where displacements were visually detected,
by cropping those from the main RGB imagery data. By turn, those were
used to find the correspondent PC regions, matching both X and Y
coordinates.
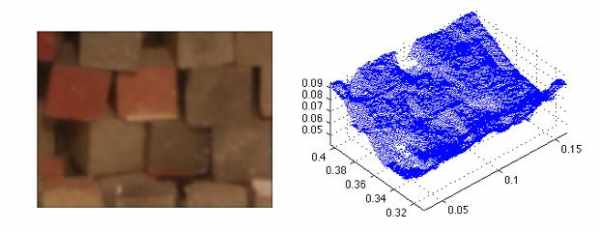
Figure 3. Due to the short spaces between some blocks
(left image), these are indistinguishable in the PC (right image).
To find the location O(XO,YO,ZO) of a block, at a given instant, the
following steps are performed (Soares et al., 2016):
- Selection, on the
RGB image, the upper top face of the aimed block, resulting in a binary
mask.
- Obtaining the correspondent distance values (Z), within
the area of the mask, by crossing it with the PC.
- Least squares adjustment of a plane model to the previous set of
distance values (Z), limiting that plane to the area of the mask.
The top face is thus estimated.
- Finding the location of the middle point P(XP,YP,ZP), of the
adjusted plane face, by computing its centroid.
- Finding the point O(XO,YO,ZO) (GC) located at the end of the
segment PO , perpendicular to the estimated plane (Fig. 2a). Spatial
displacement is obtained by computing the linear distance between
two GC locations.
4.1 Block face selection
To estimate the point P, it is necessary first to define the closed
region of interest (ROI) corresponding to the most visible face of the
target block. To gain trust about the feasibility of the proposed
methodology, it was decided that a manual selection of the ROI over the
RGB images could provide, at this stage, more solid conclusions.
Therefore, in the present study, for cubic blocks, the ROI have been
delimited by the four edges of each entire visible squared top face,
pointing the correspondent four vertices. For the tetrapod blocks, the
ROI have been delimited by elliptical shapes surrounding the entire
aimed face. The selection was done as carefully as possible, to get the
best approximation of the block face on each image. In each case, a
binary mask has been assigned and used to get the (X,Y,Z) coordinates of
the PC data points included in it.
Other scenarios, such as partially hidden blocks (Fig. 4), have
been also identified. In these cases, the main consequence lies in the
non-coincidence of the middle points of both the ROI and the true face
shape, which will have direct impact on the block’s GC 3D location. This
is a case study under solving and it is not yet able to be put on
presentation.
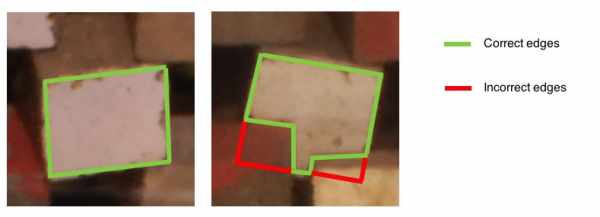
Figure 4. Hidden block situation. Left image: the
block edges are correct and a proper middle point is expected. Right
image: the edges are not correct and a deviation of the middle point is
expected.
4.2 Plane face adjustment by Least Squares
The (Xj,Yj,Zj) coordinates of the PC selected points, are given as an
input in the least squares adjustment of the 3D plane surface, further
limited to the size of the selected mask. The unknowns are coefficients
a, b and d, that define the spatial position of the plane. The 3D plane
equation model is given by the expression (1).

The sample equation system is given by the generic expression (2).
The total number of equations (n) is equal to the number of 3D points
selected in the PC.

The outcome solution for the equation
system is the vector of coefficients a, b and d (3), defining the 3D
plane that best fit the Z measured values of the selected PC data set.

The sample residuals are estimated as in the expression (4).

The estimated measures, are given by adding the residuals to the
initial distance values (5).

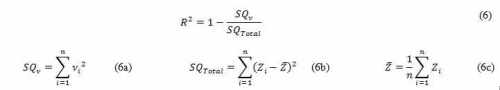
The measure of how well observed outcomes are replicated by the model
can be given by the coefficient of determination R2, computed by (6),
which refers the proportion of total variation of outcomes explained by
the model.
4.3 Estimation of the Geometric Centre of the block
The ROI having the distance values (Zj) is now replaced by the
adjusted plane, also delimitated by that ROI, in which is computed the
correspondent 3D middle point P(XP,YP,ZP). The line r that contains both
points P and O, and it is perpendicular to the plane face, follows the
director vector v=(a,b,d) (see illustration example for the cubic block
in Fig. 5). The length of PO is equal to k = h/2 = 0.016 meters.
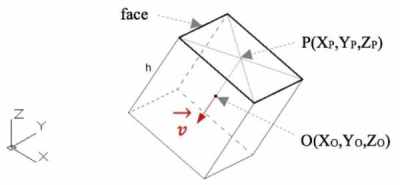
Figure 5. Relation between the face middle point P
and the GC of the block (point O).
The reduced equations that define the line r are given by (7).

The displacement D between two consecutive locations O1 and O2 is
given by the expression (8).

5. RESULTS
The following subsections show the results of the proposed
methodology applied to the two data sets introduced in Section 4. It was
extensively applied to many data samples, of which five examples were
chosen to illustrate the procedure. The accuracy of the presented
results depends of the assessment of the least squares adjustment.
Indeed, there hasn’t been done yet a complete evaluation of the distance
measurements accuracy obtained with the acquisition systems mentioned.
More tests and field campaigns should be done to obtain expertise about
more adequate system calibration and assembling. However, the obtained
coefficient of determination (6) can give a preliminary indicator of the
Z measures quality, having direct influence on the ZP value estimation
(Z coordinate of P on the block adjusted face). That indicator has been
computed only for the first data set.
5.1 Data set 1
Figures 6, 7
and 8 illustrate the methodological approaches of face selection and
plane adjustment, applied to three motion examples of cubic blocks (the
blocks were moved manually). Faces were selected on the images T1 and T2
(different instants of acquisition), followed by least squares
adjustment of a plane to each correspondent point cloud. The required GC
and displacement values are shown in the Tables 2, 3 and 4.
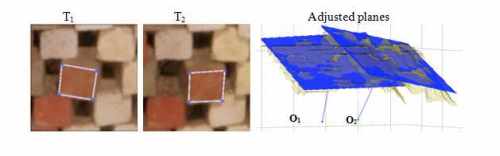
figure 6. The block unit moves to another location
and changes orientation. Coefficient of determination of the plane
adjustments: R2(1) = 91% and R2(2) = 90%.
Table 2. Coordinates
of the GC, and displacement (meters)
| CUBE |
Geometric Centre |
Displacement |
Distance |
| GC |
X |
Y |
Z |
dx |
dy |
dz |
D |
| O1 |
0.2241 |
0.4809 |
0.1231 |
0.0084 |
-0.0044 |
0.0004 |
0.0095 |
| O2 |
0.2325 |
0.4765 |
0.1236 |
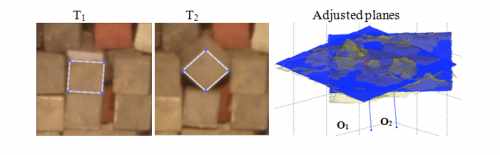
Figure 7. The block unit rotates and moves slightly.
Coefficient of determination of the plane adjustments: R2(1) = 76% and
R2(2) = 59%.
Table 3. Coordinates of the GC, and displacement
(meters)
| CUBE |
Geometric Centre |
Displacement |
Distance |
| GC |
X |
Y |
Z |
dx |
dy |
dz |
D |
| O1 |
0.1652 |
0.3034 |
0.0662 |
0.0017 |
0.0061 |
-0.0002 |
0.0064 |
| O2 |
0.1669 |
0.3096 |
0.0661 |
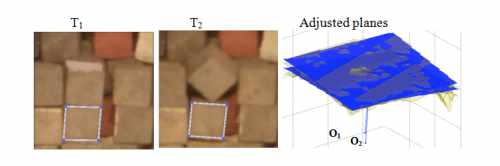
Figure 8. The block unit doesn’t move. Coefficient of
determination of the plane adjustments: R2(1) = 78% and R2(2) = 30%.
Table 4. Coordinates of the
GC, and displacement (meters).
| CUBE |
Geometric Centre |
Displacement |
Distance |
| GC |
X |
Y |
Z |
dx |
dy |
dz |
D |
| O1 |
0.1632 |
0.2722 |
0.0628 |
-0.0004 |
-0.0008 |
-0.0022 |
0.0024 |
| O2 |
0.1628 |
0.2714 |
0.0606 |
5.2 Data set 2
Fig. 9 and 10 illustrate two examples of GC estimation applied to a
tetrapod (Rocha, 2016). The top RGB images show the same tetrapod before
and after the action of the waves. The bottom images illustrate a group
of coplanar points (in white colour), representing the adjusted plane to
the selected 3D points of the PC, and the respective GC (illustration
equivalent to the previous adjusted planes illustrations). Like the
previous experience, the required values are shown in the Tables 5 and
6.
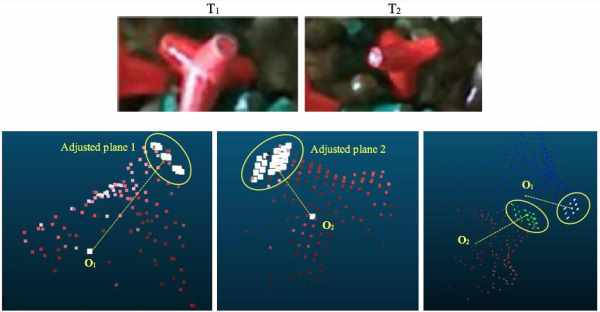
Figure 9. Example: The tetrapod unit rotates and moves.
Table 5.
Example: Coordinates of the GC and displacement (meters).
| TETRAPOD |
Geometric Centre |
Displacement |
Distance |
| Instant |
X |
Y |
Z |
dx |
dy |
dz |
D |
| T1 |
0.153 |
-0.013 |
1.221 |
0.031 |
-0.008 |
0.025 |
0.041 |
| T2 |
0.184 |
-0.021 |
1.246 |
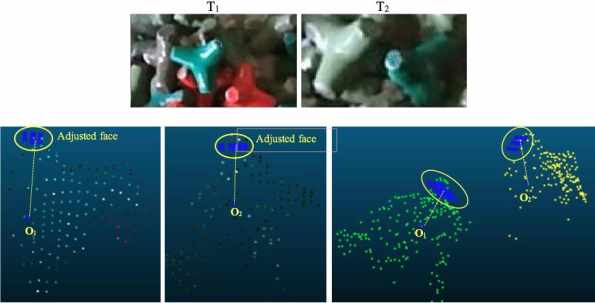
Figure 10. Example: The tetrapod unit rotates and
moves.
Table 6. Example:
Coordinates of the GC and displacement (meters).
| TETRAPOD |
Geometric Centre |
Displacement |
Distance |
| Instant |
X |
Y |
Z |
dx |
dy |
dz |
D |
| T1 |
0.055 |
-0.037 |
1.234 |
0.049 |
-0.051 |
0.043 |
0. 083 |
| T2 |
0.104 |
-0.088 |
1.277 |
6. DISCUSSION AND CONCLUSIONS
The proposed methodology integrates imagery and point cloud data to
improve BW models monitoring. The innovative proposal of point cloud
adjustment, driven by the segmentation of block imagery data, proves to
be an asset to the effectiveness of block geometric centre estimation
and tracking. It depends, although, of a clear identification of target
plane faces of the block units on the images. This is a key factor, for
which it was decided not to focus the study in the image processing task
of region segmentation. Manual selection was made instead.
The Kinect V2 device, having a system with both integrated RGB and IR
cameras, proves to be an asset in terms of surveying cost and quickness.
However, it should be noted that, according to Fankhauser et al (2015),
the optimal distances from the object, for a higher accuracy, stays
between 1 meter (the closer one) and 2 meters (the distant one). At a
distance range between those values, the small circular/elliptical faces
of the tetrapods (10 millimeters of diameter) may not catch enough
sample points in the PC, which may lead to less accurate adjustment
results for adjusted plane. Nevertheless, future experience improvements
should clarify more this important methodological aspect.
It is important to notice that the point cloud quality depends
strongly on the algorithms used for creating the output data (Lachat et
al, 2015). A good knowledge of sources of errors affecting the
measurements of a system is needed to quantify the accuracy of the data
provided by it. The registration accuracy of both RGB imagery and PC
data is also an important that should work in favour of a good matching
between those. Taking these aspects, we should say that it will be of
great importance to further include a section dedicated to the
description of the accuracy subject, to validate a capable system of BW
model monitoring. However we are able to conclude that, based on the
preliminary results presented in several block’s motion examples, the
functional approach aiming the estimation of block’s location, achieves
the main objective proposed at the beginning of this presentation.
Another importance of this study is that the methodology of detection
of regular blocks in RGB images and determination of the location of the
GC of blocks from PC can be applied to real BW, with no need for
adaptation. Nowadays, the evaluation of the stability of BW is based in
visual inspections or in comparisons of photos or videos. In all the
cases the information is obtained from the crest of the BW, place that
has low or no visibility for same areas of the outer layer. The analysis
of the damages of this protection layer and their evolution is
qualitative, no measurements are made. For this reason, the detection of
displacements can’t be demanding: according to LNEC’s Stability
Criteria, the estimated displacement only is relevant when it is larger
than the size of a block. With the use of methods that can determine the
location of the GC of blocks, and therefore their displacements, with
accuracies of 20 cm or less, as expected from studies performed by LNEC,
the monitoring of BW can be based in a quantitative method, which is
much more accurate. And the use of these techniques will allow other
studies, like the detection of small settlements, dangerous because
these can be the sign that finer material from the core of the BW is
being washed out.
7. FUTURE STUDY
The selection of the regions, from the RGB image, was done manually,
to test and assess the present methodology. This task turns rapidly into
a drawback, if a set of blocks are to be monitored simultaneously.
Therefore, edge/hybrid-based image segmentation approaches are under
development to extract several ROI at the same time from the RGB
imagery, with a minimal human intervention. To optimize this procedure,
the blocks’ colour standardization is also under discussion.
As referred in Section 4.1, the location of point O (GC coordinates)
is computed from the location of the shape’s middle point P, which
depends of its proper shape definition. When one block is partially
hidden by another, that is not possible. This situation is also a top
concern that is being studied for further presentations.
Also, the perspective of extending the approach to a real scenario
BW, is a project to develop at medium term.
REFERENCES
Fankhauser, P. ; Bloesch, M. ; Rodriguez,
D. ; Kaestner, R.; Hutter, M. ; Siegwart, R. (2015). Kinect v2 for
mobile robot navigation: Evaluation and modeling. Proceedings of the
17th International Conference on Advanced Robotics, ICAR 2015,
pp.388–394.
Henriques, M.J. ; Braz, N. ; Roque, D. (2015). Point clouds
and orthomosaics from photographs: Their use in a Civil Engineering
Laboratory. FIG Working Week 2015, Sofia, Bulgaria, 17-21 May 2015.
Henriques, M.J. ; Braz, N. ; Roque, D. ; Lemos, R. ; Fortes, C.J.E.M.
(2016). Controlling the damages of physical models of rubble-mound
breakwaters by photogrammetric products - Orthomosaics and point clouds,
3rd Joint International Symposium on Deformation Monitoring, Vienna,
Austria, 30 March – 1 April 2016.
Lachat, E. ; Macher, H. ; Mittet,
M.-A. ; Landes, T. ; Grussenmeyer, P. (2015). First Experiences with
KINECT V2 Sensor for Close Range 3D Modelling. 3D Virtual Reconstruction
and Visualization of Complex Architectures, Avila, Spain, 25-27 February
2015. Reis, M.T. ; Silva, L.G. ; Neves, M.G. ; Lemos, R. ; Capitão, R. ;
Fortes,
C.J.E.M. (2014). Physical Modelling as a Fundamental Tool for
the Design of Harbours and Maritime Structures.
PIANC Yearbook 2014.
Rocha, C. (2016). Monitorização dos modelos de quebra-mares com o sensor
Microsoft Kinect. Master Thesis in Geographical Engineering, Faculty of
Sciences of the University of Lisbon. Soares, F. ; Henriques, M.; Braz,
N. (2016). Integration of Image Processing Tools for Monitoring
Breakwaters Models. Poster presentation. European Space Agency Living
Planet Symposium, Prague, Czech Republic, 9-13 May 2016.
BIOGRAPHICAL NOTES
Fernando Soares is an Assistant Professor at the
Faculty of Sciences of the University of Lisbon. His research activities
include Digital Image Processing, Mathematical Morphology, Coastal
Monitoring.
Maria João Henriques is a Senior Research Officer at the
Applied Geodesy Division of LNEC. Her research activities include
Geodetic Surveying Systems design and quality control, atmospheric
effects on the measurements, Calibration of equipment, Photogrammetry.
César Rocha is MSc. Student of Geographical
Engineering, currently working on a thesis under the subject of
“Monitoring of breakwater physical models with the Kinect sensor.
CONTACTS
Fernando Soares
Faculty of Sciences of the University of Lisbon Campo Grande,
Ed. C8,
Lisbon,
PORTUGAL
Tel. +352 217 500 836,
Email:
fjsoares@fc.ul.pt
Maria João
Henriques
Laboratório Nacional de Engenharia Civil
Av. Brasil 101,
Lisbon,
PORTUGAL
Tel. +351 218 443 396,
Email:
mjoao@lnec.pt
|


