Article of the Month - January 2025
|
Unlocking the Potential of Earth Observation
Data in Cultivating a Climate-Resilient City

Nok-hang NG, Hong Kong SAR, China
This article in .pdf-format
(23 pages)
SUMMARY
In October 2021, the Government of the Hong Kong Special
Administrative Region published the "Hong Kong's Climate Action Plan
2050" to build upon the previous "Hong Kong's Climate Action Plan
2030+". One of the key strategies of this new plan outlines the measures
of climate change adaptation and resilience, with the aim of protecting
the lives, health, and property of the people from extreme weather
events, as well as strengthening the overall resilience of the community
in Hong Kong.
The adaptation strategy focuses on solutions to combat extreme
disasters and weather events, while also safeguarding the water supply.
The resilience strategy, on the other hand, concentrates on preparedness
to more extreme disasters and enhancing capabilities in post-disaster
recovery.
Earth Observation (EO) data can play a crucial role in implementing
these strategies in both monitoring and evaluation. Through structural
collection of EO data, well-defined methodologies, application of
comprehensive spatial tools and GeoAI algorithms, and spatial
presentation capabilities, EO data can be leveraged to provide
recommendations to policymakers in understanding the effectiveness of
policies and making more informed decisions related to climate change
adaptation and resilience. It also highlights the pivotal involvement of
Hong Kong's land surveyors in contributing to the achievement of the
United Nations' Sustainable Development Goals (SDGs) through their work
in this domain.
1. WEATHER RELATED THREATS
According to the World Meteorological Organization’s preliminary
assessment, 2023 is likely to be the warmest year on record (WMO, 2024).
Global mean sea level continued to rise, reaching a new record high in
2023 (Johnson et al., 2024). The Sixth Assessment Report from the
Intergovernmental Panel on Climate Change (IPCC) confirms that
human-induced climate change is unequivocal, with global temperatures
1.1°C higher than pre-industrial levels. The report addressed the
scientific study on climate change, which is already affecting every
inhabited region across the globe, with human influence contributing to
many observed changes in weather and climate extremes (IPCC, 2021).
Like other coastal cities, Hong Kong is prone to the impacts of
climate change. The mean sea level in Victoria Harbour went up at an
average of 31 mm per decade from 1954 to 2020 (HKO, 2024). With all
twelve months warmer than usual, 2023 was one of the second warmest
years on record, with the annual mean temperature reaching 24.5 degrees,
1.0 degree above the 1991-2020 normal (HKO, 2024). Over the past
century, the number of very hot days in Hong Kong increased from 2.2 to
21.7 days, and the number of hot nights increased from 0.7 to 27.3
days. Every year, around 16 tropical cyclones occur inside Hong Kong’s
area of responsibility, which pose different levels of threat to Hong
Kong (HKO, 2024). For instance, the passage of Super Typhoon Mangkhut in
2018 caused at least 458 injuries. There were more than 60,000 reports
of fallen trees, the highest number on record (HKO, 2020).
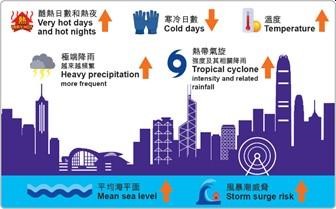
Figure 1 - Climate Change in Hong Kong (HKSAR
Government, 2024)
2. RESPOND TO THREAT
The inter-departmental Steering Committee on Climate Change and
Carbon Neutrality, chaired by the Chief Executive, was established in
July 2021 to formulate the overall intergovernmental strategy and
oversee the coordination of various actions (HKSAR Government, 2021).
The Government of the Hong Kong Special Administrative Region then
published the "Hong Kong's Climate Action Plan 2050" to build upon the
previous "Hong Kong's Climate Action Plan 2030+" after three months
(HKSAR Government, 2021). One of the key strategies of this new plan
outlines the measures of climate change adaptation and resilience to
protect the lives, health, and property of the people from natural
hazards and strengthen the overall resilience of the community in Hong
Kong (EB, 2021).
To oversee the effective implementation of all these actions, the
Environment and Ecology Bureau (Previously named the Environment Bureau)
set up the Office of Climate Change and Carbon Neutrality, led by the
new Commissioner for Climate Change to strengthen coordination among
government departments on the strategies, policies, and action plans in
combating climate change (HKSAR Government, 2021). In addition, the
Council for Carbon Neutrality and Sustainable Development, a dedicated
advisory council from widespread public stakeholders, was formed in May
2023 to offer advice to the Government and promote public awareness and
understanding of climate change (HKSAR Government, 2023).
Considering the accumulation of experience in combating natural
hazards, including tropical cyclones, rainstorms, and sea level rise,
Hong Kong has laid a solid foundation for strengthening the design of
buildings and infrastructure facilities, and enhancing drainage
management and landslip preventive measures. Resilience focuses on
preparing for emergencies by raising community awareness, preparing
contingency plans for natural disasters and transport systems, and
improving warning and monitoring systems (HKSAR Government, 2021).
3. EARTH OBSERVATION INDUSTRY
According to the EU Agency for the Space Programme (2024), Earth
Observation (EO) is the process of gathering information about the
Earth's surface, waters, and atmosphere via ground-based, airborne and
satellite remote sensing platforms. The United Nations General Assembly
Resolution 41/65 of 1986 addressed the principles of remote sensing and
reflected the best practices of spacefaring nations, which the activity
means the operation of remote sensing space systems, primary data
collection and storage stations, and activities in processing,
interpreting, and disseminating the processed data. (United Nations
General Assembly, 1986). The advancement of technology, the initiative
of commercializing space (US Government, 2015) (European Commission,
2016), and the adoption of an open data policy of satellite imagery data
(Irons et al., 2012; European Commission, 2014) empowered the rapid
growth of all sectors of the EO industry. Generally, the EO industry can
be categorized into a pipeline from (i) data collection, and (ii) data
processing to (iii) services and applications from spaceborne and
airborne data, supplemented by in-situ ground truth data.
The data collection sector is considered the upstream component in
the EO industry, collecting petabytes of data about our planet daily
from various sensors. Public and private entities worldwide are
launching diverse sensors on satellite constellations into the polar or
geostationary orbit, either for regular data capture missions or
on-demand tasking. Active sensors emit energy, capturing reflected light
across various wavelengths, while passive sensors detect naturally
occurring light, capturing a broad spectrum of electromagnetic waves.
The captured data is then directly transmitted to ground segment
infrastructure for further use. Additionally, following defined
flight plans, sensors mounted on aircraft and helicopters are commonly
deployed to collect territory-wide data. Lightweight sensors on unmanned
aerial vehicles have also become favorable for collecting EO data in
smaller regions.
The data collected from spaceborne and airborne sensors is named
primary data (UNGA, 1986). The data processing sector conducts various
preprocessing operations on this primary data, such as atmospheric,
radiometric, and geometric corrections (Frazier et al., 2021).
These preprocessing steps generate different types of processed data
(UNGA, 1986), or named derived data, with each level of processing
derived to the needs of the end-users. For example, some companies offer
Analysis Ready Data (ARD), a finalized level of processing that includes
all necessary preprocessing steps, mosaicking, tiling, seamline editing
and color enhancement from multiple sources, before delivering the data
to users. Users can then access or download the ARD product directly for
their own application. Additionally, many public and private
organizations have developed cloud-based platforms with well-defined
catalogs to facilitate easy searching, fast streaming, and downloading
of large data sets. These platforms also provide on-the-fly data
processing functions (Microsoft, 2024; EODH, 2024; ESRI, 2024). For
example, the Copernicus program from the EU employs a multi-pronged
approach for the public to access Sentinel Reference Products and
Copernicus Services Reference Products such as Copernicus Open Access
Hub, the Collaborative Data Platform, as well as the individual
Copernicus service-specific web portals (Copernicus, 2024).
The advancements in artificial intelligence and cloud computing
enable service providers in the service and application sector to
integrate EO data with other relevant spatial data sources to develop a
wide range of applications across multiple domains. Combining with
various geospatial datasets, EO data is not only used to create detailed
and up-to-date maps that can aid in land management, urban planning, and
infrastructure development (Kakiuchi, 2002; Cantou, 2018; IGN FI, 2024),
but also applies in the environmental domain. The integration of EO data
with ground-based sensors and socioeconomic information has enabled the
development of applications for monitoring environmental and
meteorological parameters, assessing climate change impacts. The
integration of EO data has also proven valuable in the social and
governance domain, where it is used to track and report on
sustainability metrics, monitor human settlements, and support urban
planning and management decisions (Mihir et al., 2020). As
demonstrated in the study by Dang et al. (2022), precise agriculture is
another area where the fusion of EO data with AI analytics has
revolutionized precision farming practices, optimizing resource use and
improving crop yields. These applications have been instrumental
in supporting policymakers and decision-makers with data-driven
insights.
As technological advancements continue to unfold, the future holds
the promise of even lighter and smaller EO payloads (Kääb et al., 2021).
Satellite and aircraft-mounted instruments capable of millimeter-grade
resolution (Smith et al., 2020), hyperspectral imaging (Marinelli et
al., 2019), and multi-return LiDAR (Wang et al., 2021) will soon be
available, enabling the collection of precise and accurate information
about our planet. Alongside these hardware improvements, the maturation
of edge computing and other data processing techniques accelerate the
transformation of primary data into ARD products (Guo et al., 2020) in
3D-oriented (Maxar, 2022) and real-time. These products can create more
applications that analyze complex issues and develop solutions to
address the intricate challenges facing by our world. The ability to
continuously monitor and understand the human footprint on the planet is
crucial, and EO data is emerging as a vital tool in this endeavor.

Figure 2 - The Categorization of EO Industry
4. EO APPLICATION IN CLIMATE ADAPTATION AND RESILIENCE
4.1 Quick Response and Recovery
When severe natural hazards affect Hong Kong, an alert message needs
to be quickly disseminated to the public, and the Government must
respond quickly to allow the community to return to their normal daily
activities at the earliest opportunity. The Government's
interdepartmental steering committee coordinates government departments
and supervises the various stages of preparedness, contingency, and
recovery, as well as setting priorities for different response tasks, so
that various government departments can take prompt action under their
domain. In this regard, accurate information sharing becomes essential.
4.1.1 Share Additional Data in Emergencies
To support the real-time sharing of emergency information brought by
natural hazards among relevant government departments, government
departments such as Geotechnical Engineering Office (GEO) of the Civil
Engineering and Development Department (CEDD) makes use of Common
Operational Picture (COP) in an Emergency Monitoring and Support Centre
(EMSC) to display and monitor the city's situation in real-time,
facilitating the formulation of contingency plans and measures (HKSAR
Government, 2020). The sharing of EO data, such as satellite orthomosaic
and aircraft orthomosaic can provide a comprehensive and up-to-date
scene of the territory, allowing the real-time identification of the
extent of the affected area and its respective land cover type present,
which then facilitates a regional basis damage assessment and the
allocation of its resources in response to the disaster, and to
prioritize the most severely affected area in need of immediate
attention. By sharing consistent information and the latest status,
different government departments in the COP that are responsible for
different rescue actions can be seamlessly corporate and allocate
resources effectively.
The EO data should be integrated into the COP for prompt sharing. The
current technology allows the file transfer of large formats of EO data
via cloud, streaming directly over the network is another option. By
breaking down the large pixel size image into smaller and tiled formats,
web map technologies like WebGL, Cesium or OpenLayers allow real time
streaming and visualization of the tiled imagery data. This approach
reduces the initial download time and allows users to access and
interact with the imagery data on-the-fly. Using the technologies of
block-level storage and pyramid tiling methods for initial preview in
lower resolution, the data format of Cloud-based Optimized GeoTIFF (COG)
is available for faster data streaming (COGEO, 2024).
Additionally, using open-source formats for sharing is recommended. This
approach enables government departments to access the information more
easily, enhances data exchange and collaboration between them, and
reduces the risk of system failures during peak times. (DSIT, 2012).
In addition to the technology itself, an efficient data-sharing
mechanism or a consent-based data exchange gateway among government
departments and EO data providers is recommended. This would facilitate
the exchange of EO data stored in various departments or image
providers, ensuring that data is shared only after obtaining consent
prior to a disaster. It can shorten the data acquisition time,
facilitate efficient data access, and seamless integration with existing
systems among government departments. Moreover, commercial satellite
image providers commonly offer government licenses or even free usage of
their imagery data in response to disasters (CASC, 2022; Planet Labs
PBC, 2024; Maxar, 2024), leveraging the full potential of EO data
governance in emergencies.
4.1.2 Provide Alternative Data Collection Option
The affected area cannot be accessed safely during and after the
natural hazards because of falling trees, landslides, and road blockage.
There may be safer solutions than deploying a ground inspection team to
collect first-hand information on inaccessible areas or most damaged
regions. The popularization of drones equipped with optical sensors
provides an alternative option to understand the affected area by
capturing the site photo and video. It has become popular for
governments in both developed and developing countries such as the US,
Japan, and Vietnam, to establish a drone team to undertake a rapid
damage assessment after a disaster (Akhloufi et al., 2021; Mikio, 2024;
Duong, 2023). Compared with ground inspection, the drone captures more
spatial information in a shorter time, the ability to generate the
orthophoto, maps, and other ARD products allows the subsequent review of
complicated damage assessment.
Given the popularization of drone use, the Small Unmanned Aircraft
(SUA) Order (Cap. 448G) with a restricted flying zone took full effect
in Hong Kong on 1 December 2022 to seize the immense potential of SUA
application while safeguarding aviation and public safety (HKSAR
Government, 2022). Considering the principle of SUA Order and
demand of using drones in response to disasters, there are also needs in
preparing disaster-specific regulations or establishing protocols to
enforce airspace rules, air traffic control, lifting restricted flying
zones temporarily and controlling the sharing and use of drone data with
coordination across government and non-government sectors. (Greenwood et
al., 2020). It can allow prompt response and more efficient allocation
of resources to areas most in need.
Additionally, one of the measures of drone management in response to
the disaster is to set up an electric fence to control the air traffic
in the affected area. Any authorized drones for rescue purposes are
allowed to enter, while those without authorization will be prohibited
from entering the fence-off area. Similar to the air traffic management
system for aircraft, electric fences require a cloud-based system
connecting all registered drones with geofencing technologies to monitor
the flight data; the system can incorporate an alarm function when these
drones fly into a restricted electric fence zone. A similar practice has
been governed in the Interim Provisions on Light and Small Unmanned
Aircraft Operations (UAS Operation Provisions) issued by the Civil
Aviation Administration of China (CAAC) in December 2015.
4.1.3 Identify Affected Area with Analytic
Typhoons and heavy rainstorms often lead to flooding, especially when
heavy rainfall occurs hourly, posing significant threats to low-lying
areas. Synthetic Aperture Radar (SAR) data can be used to identify
flooding areas during or after the heavy storms by comparing the SAR
data before, during, and after the event. Water surfaces typically have
lower backscatter signals than dry land, making them easily identifiable
in SAR images. Integrating with the topographic map, the extent of
flooding can be delineated. Compared with optical imagery, the SAR
signals are able to penetrate the cloud, regardless of time, allowing
for near real-time monitoring of flood events. CUHK demonstrated the use
of three Gaofan-3 SAR images to identify the severe flooding area (CUHK,
2023). The identification of black spot areas (flooding areas) is
important to government departments who need to evacuate residents, pile
sandbags, and install water-stop boards. Besides, the airborne thermal
infrared data can provide a broader, regional perspective on the local
temperature and heat/cold stress patterns across an affected area (Janet
et al., 2012). This information can help identify the communities and
neighborhoods experiencing the most extreme temperatures, highlighting
the areas with the greatest need for temporary heat or cold shelters.
Thus, it can be used as an indicator to determine the demand and supply
of Community Halls or Community Centers as temporary heat or cold
shelters to provide temporary accommodation to people who need to take
refuge from the heat and cold.
4.2 Precise and Persistent Monitoring
4.2.1 Support Coastal Management and Sponge City Initiatives
Numerous tide gauge stations monitor tidal levels in Hong Kong (HKSAR
Government, 2024), and provide a continuous record of sea level changes
over time. This data is essential for monitoring long-term trends and
understanding the impacts of climate change on sea level rise. However,
the tide gauge stations are limited to specific coastal locations, so
the measured levels may not represent other regions without stations.
Satellite and aerial data such as LiDAR and imagery can complement
the in-situ tide gauge measurements and extend the coverage to areas
without direct observations. A clear workflow is demonstrated to
integrate Landsat images with the tide gauge network, generate terrain
models, and provide sea level data for regions where direct measurements
are unavailable (Robbi et al., 2021). Use of Airborne LiDAR data
is also common for shoreline mapping and coastal management (Wang et
al., 2023). The Cartographic and Geologic Institute of Catalonia (ICGC)
demonstrated the case of mapping an area from 50m inland to 10m water
depth of the Catalan coastal zone using airborne LiDAR bathymetry (ALB)
as a baseline for continuous coastal monitoring, proving its data
collection ability in both land and low-depth sea area (Charles et al.,
2023). Another example is that NOAA from the US has identified the
flood risk and has monitored the coastal change using LiDAR since the
mid-1990s to form part of the United States Interagency Elevation
Inventory and created the Coastal LiDAR Data holdings as publicly
available (NOAA Coastal Services Center, 2012; NOAA Office for Coastal
Management, 2023).
The EO data provides the scientific foundation to strengthen the
findings on urban coastal preventive measures. This precise data can
support coastal risk assessments or shoreline management studies to
identify low-lying or windy residential areas with higher risks (HKSAR
Government, 2022). It can be used as a parameter to test, or model
proposed mitigation measures, such as determining the optimal height and
location of new coastal barriers or man-made seawalls, as well as the
appropriate formation level of reclamation. Using LiDAR data as one of
the topographic and bathymetric data, it provides an as-built survey for
spectral wind-wave model to simulate the growth, decay, and
transformation of wind-generated waves and swell, wave overtopping
analysis and coastal flood inundation assessment to identify the area
vulnerable to coastal risk (Dongmei et al., 2019; Nederhoff et al.,
2024). This information can then inform the formulation of improvement
works and management measures to prevent waves and floods from directly
impacting the public, safeguarding public safety.
Furthermore, the development of sponge city is one of the resilience
measures to alleviate the impact of coastal hazards (WSP, 2024). From
the flood management perspective, this initiative is for the city to
function like a sponge during rainy periods - absorbing, storing,
filtering, cleaning, reusing, and controlling the discharge of
rainwater, then using it as needed to improve ecological function and
reduce flooding, thereby reducing the need for grey infrastructure, the
large-scale artificial drainage infrastructure.
To put the sponge city concept into practice, some sponge city
features will be incorporated into urban development projects. These
features include rainwater gardens, urban lakes, and wetlands to retain
flood water and revitalize water bodies. These sponge city features will
be combined with sustainable drainage elements such as green roofs and
porous pavement (Stephan, 2021). EO data can serve multiple functions to
support the proactive placement and design of suitable sponge city
features. EO data not only acts as a data source to improve simulation
models, but also provides a way to evaluate the effectiveness of green
infrastructure in enhancing the city's water infiltration and storage
capabilities (FAO, 2023). The trend of EO sensors supporting
hyperspectral image capturing provides a valuable tool for identifying
unique spectral signatures from vegetation species. This data can be
used to map the spatiotemporal distribution and characteristics of
vegetation species over vast areas. Additionally, LiDAR with
near-infrared wavelengths is able to collect multiple returns from
ground surfaces. By monitoring changes in vegetation over time, EO data
can measure the tree canopy, tree height and other tree inventory
information. Furthermore, evapotranspiration, the combined process of
soil evaporation and plant transpiration, is a crucial component of the
water cycle and plays a significant role in the water-holding capacity
of sponge cities. Multi-source EO data can be used to estimate the land
evapotranspiration rate (Zheng, 2022). All these data facilitate the
assessment of the green infrastructure’s growth, survival, and overall
performance.
Currently, the spatial resolution and temporal resolution of
spaceborne hyperspectral sensor may be too low to support individual
tree analysis. To address this issue, public sector, i.e. EO-1 hyperion
(EROS, 2019), and commercial sector, i.e. Tanager-1 (Planet Labs PBC,
2024) and Pixxel (Pixxel, 2024) start to launch a sub-meter to meter
grade resolution of hyperspectral sensor. In contrast, recent studies
have demonstrated the use of airborne or in-situ hyperspectral data to
determine the species information. Hou et al. combined spatial and
spectral information collected by hyperspectral sensors mounted on
drones of the Chinese Academy of Surveying and Mapping in the Tiegang
Reservoir Dataset, resulting in a spatial and spectral resolution in
0.1m and 5nm in 112 bands respectively. Abbas et al. collected tree
spectral information from the handheld hyperspectral camera to evaluate
the tree information with several indexes. Laurin et al. demonstrated
the use of in-situ spectra measured by a spectrometer to compare with
spectra of tree tops measured from Sentinel-2 satellite images for a
forest phenology study.
4.2.2 Strengthen the Slope
Slopes in Hong Kong can be differentiated into natural terrain and
man-made slopes. Natural terrain defines the hillsides that human
activities have not substantially modified, while man-made slopes are
formed by cutting into hillsides and/or earthfilling. Over 60% of the
area in Hong Kong is defined as natural terrain (CEDD, 2016). CEDD
is responsible for regular inspection and preventive maintenance of
government slopes, requiring private owners to fulfill their duties in
maintaining their slopes and exercising geotechnical control on public
works and private development projects to ensure slope safety (CEDD,
2019). Natural terrain landslides, such as open hillslope landslides,
channelized debris flow, and debris floods, are common in Hong Kong (NG
et al., 2018), especially after extreme storm and typhoon. As the
consequences of landslides pose a great threat to human life and
property, preventive measures and identification of potential landslide
areas become essential. EO data has become an indispensable data source
for early identification and monitoring of landslide-prone areas.
Detailed interpretation of aerial photos, while often hindered by dense
vegetation cover, can still provide valuable insights into the terrain's
condition, such as the presence of cracks and other subtle signs that
precede larger-scale slope failures (Guzzetti et al., 2012). The advent
of airborne LiDAR technology has significantly enhanced this capability,
enabling the creation of high-resolution digital terrain models that can
penetrate the vegetation canopy and reveal the underlying landform
features (Razak, 2011).
The Enhanced Natural Terrain Landslide Inventory (ENTLI) compiled by
the GEO demonstrates the power of aerial photos with aerial photo
interpretation and advanced GeoAI techniques for systematic
identification (GEO, 2020). By training the annotated landslide on
aerial photos, quantitative risk assessments can be conducted to
diagnose the risk characteristics of natural terrain landslides and
devise a risk-based prioritization system to identify the area with
higher landslide risk to follow up under Landslip Prevention and
Mitigation Programme (LPMitP) (GEO, 2021). LPMitP allows the authorities
to implement appropriate landscape treatments and soil bioengineering
measures to minimize the impact of potential slope failures (Choi et
al., 2018). While these measures may not be sufficient to cover
all large-scale and rare landslide events, they can significantly reduce
the overall risk and provide additional time for evacuation and
emergency response.
Very high-resolution of satellite images and aerial photos allow for
non-invasive inspection of man-made slopes, identifying subtle changes,
cracks, and other signs of distress that may precede a catastrophic
failure (Jaboyedoff et al., 2012). However, high-rise buildings
blocked line of sight, generating significant geometric distortion and
shadow, thus increase the difficulties in forming the terrain model,
airborne LiDAR data with higher density is the way to overcome it, it
can generate highly accurate, 3-D models of man-made slopes, revealing
the precise geometry, structural integrity, and any deformations that
may be occurring (Lato et al., 2015). By establishing comprehensive
baseline data and monitoring these slopes over time, maintenance
responsible parties can use it to assess the stability of retaining
walls and cut slopes and design appropriate retrofitting or
reinforcement measures. Together with other spatial data, i.e.,
topographic map and SIMAR slope polygon (SMO, 2024), the government
departments can detect emerging issues and take statutory actions
through an ordinance to ensure its rectification under the LPMitP.
Apart from airborne LiDAR, more LiDAR sensors have been launched into
space, providing wider coverage, and better temporal resolution when the
sensor accuracy has been improved. This satellite LiDAR data is combined
with other ground-based monitoring techniques, such as GPS sensors and
ground-based LiDAR scans, to provide a comprehensive view of slope
stability in areas prone to landslides. Specifically, the Canadian
Forest Service and Natural Resources Canada from the Canadian Government
have been using altimeter data from ICESat-2 together with Airborne
LiDAR to generate territory-wide high-resolution digital elevation
models and slope maps (Natural Resources Canada, 2023). It can be
used to monitor landslide and slope stability on a regional basis
persistently.
SAR has the advantage of detecting small ground movements. By
analyzing a series of SAR images and employing data processing
techniques—such as interferogram generation and phase
unwrapping—Persistent Interferometric SAR (PInSAR) enables the
quantification of displacement and the early identification of potential
instability in the ground. However, high-rise buildings in urban
environments like Hong Kong can cause significant radar signal
scattering multipath and shadowing effects, which reduce the
effectiveness of SAR data collection on the ground (Zhao et al., 2016;
Yang et al., 2016). Given these factors, applying SAR technology in
larger flat areas and regions with lower building density is more
effective. Such environments reduce the impact of signal interference,
allowing for more precise and reliable data interpretation, ultimately
enhancing the effectiveness of monitoring geological stability and urban
infrastructure.
4.2.3 Monitor the Land Cover Change for Regional Land Management
Land cover map (LCM) describe the physical material and man-made
features on the surface of the Earth. This information goes beyond just
identifying land use – it also captures the physical characteristics of
the landscape, including vegetation type, density, and health according
to a well-defined nomenclature and classification scheme (FAO, 2024). By
mapping these attributes across large geographic areas, land cover data
creates a detailed spatial inventory of the natural and built
environments.
LCM can be used to identify vulnerable hotspots and precisely target
adaptation interventions, it provides a detailed, spatially explicit
understanding of the region’s current environmental conditions and
landscape characteristics across a region. This information can be used
to pinpoint areas that are particularly vulnerable to the impacts of
climate change such as the low-lying coastal areas, impervious surfaces
and green infrastructures, marginal agricultural lands, and high
wildfire risk areas. With a clear understanding of vulnerable hotspots,
LCM can guide the targeted deployment of adaptation interventions. This
can analyze the optimal locations of various measures like flood
barriers, wildfire breaks, or green infrastructure to protect high-risk
areas. Land cover information can also inform the design and placement
of these interventions to ensure they are well-suited to the local
environmental conditions. Spatial-temporal land cover mapping enables
the persistent monitoring of landscape changes, such as urbanization
patterns in suburban areas and deforestation rate in protection zones or
shifts in vegetation – crucial for evaluating the efficacy of adaptation
efforts.
Development of robust, up-to-date LCM relies on integrating various
EO data sources and cutting-edge analytical methods, including GeoAI. A
common approach is to leverage satellite imagery, to conduct land cover
classification across rural and natural areas, as demonstrated by
programs like the European Union's CORINE Land Cover, supported by the
European Space Agency (ESA). Meanwhile, the US Geological Survey (USGS)
cyclically updates its 30-meter National Land Cover Database (NLCD)
using Landsat satellite data in US. Moving to higher resolutions,
the Chesapeake Bay Program in the US has created detailed 1-meter land
use and land cover maps by combining National Agriculture Imagery
Program (NAIP) aerial imagery with LiDAR-derived height data.
Similarly, the UK Centre for Ecology & Hydrology (UKCEH) publishes a
national-scale 10-meter land cover map of the UK using Sentinel
satellite imagery. Beyond national-level efforts, local initiatives have
also leveraged advanced EO technologies - for example, government-funded
studies in Japan (Naoto et al., 2024) and Singapore (Gaw et al., 2019)
have showcased the use of deep learning algorithms like U-Net to
generate sub-meter LCM from very high-resolution aerial and satellite
imagery. In Hong Kong, the Agricultural and Fisheries and Cultivation
Department (AFCD) and the Chinese University of Hong Kong (CUHK) explore
the potential of using Worldview satellite images to identify and map
major terrestrial habitats in Hong Kong (Kwong et al., 2022). The
Planning Department (PlanD) of the HKSAR Government funded a project to
develop a workflow to combine land use and land cover from
mid-resolution satellite images to form a Utilization Map (Remote
Sensing Laboratory, 2024). Thus, integrating diverse EO data
sources, from medium-resolution satellites to high-resolution aerial and
satellite imagery, combined with cutting-edge analytical methods,
enables land management authorities to develop comprehensive,
multilayered LCMs that support precise, data-driven climate resilience
strategies.
The development of effective LCM faces several critical challenges
that must be addressed to ensure their persistent use and impact.
Firstly, it is essential to clearly define the objectives and desired
outcomes of the LCM, aligning it with the specific needs of land
management authorities and urban planners such as land utilization use,
habitat map and vegetation map, and requiring a deep understanding of
the decision-making contexts in which these maps will be applied.
Secondly, establishing well-defined, hierarchical nomenclature and
classification schemes is crucial to combat the inherent complexity of
real-world land cover conditions. Dynamic and adaptable classification
systems are needed to accurately capture the nuances and changes in land
cover, especially in rapidly evolving urban and peri-urban environments.
Ensuring persistent monitoring and accounting for the relatively short
lifespans of many satellite platforms further complicates maintaining
up-to-date, time-series LCMs. Selecting suitable EO data sources is
another critical challenge, as different sensor types, spectral
resolutions, and spatial scales can significantly impact the accuracy
and granularity of LCMs. Integrating multi-source EO data, such as
satellite imagery, SAR data, and aerial orthophotos, hyperspectral data,
requires understanding the strengths and limitations of this diverse
dataset, i.e., availability of data, the capability of workflow,
artifacts of data etc. Design of a harmonized workflow is required to
address the limitations and maximize the strength of each of this
dataset. Finally, the prediction performance of advanced analytical
techniques, such as deep learning models, heavily depends on the quality
of the training data, and accuracy assessment. Establishing
comprehensive, high-quality land cover labeling and validation datasets,
potentially with the support of field-based spectroscopic measurements,
i.e., spectrometers, along with rigorous accuracy assessments for
fine-tuning hyperparameters and evaluating sufficient sampling results,
are essential to unleashing the full potential of these cutting-edge
GeoAI methods.
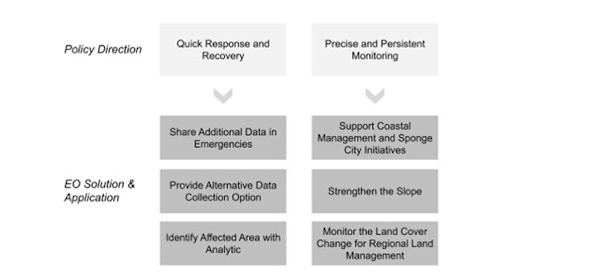
Figure 3 - The Summary of Recommended Policy
Direction and Respective EO Solutions and
5. CONCLUSION
In addressing climate change issues, remote sensing technology makes
EO data available to support quick responses before climate events
arrive and quick recovery after hazards like superstorms and typhoons in
Hong Kong. Additionally, EO data enables precise and persistent
monitoring of rising sea levels, identifying low-lying areas and
potential landslides, mapping of habitat and vegetation coverage, and
rising urban temperature. To effectively use the EO data in implementing
climate resilience and adaptation policies in Hong Kong, best-practice
surveys are crucial to ensure accurate data collection, completeness of
processing workflow, consistent results and quality deliverables,
creating a reliable foundation for injecting EO data and other
geospatial data from insight to implementation that generate significant
long-term benefits to our living environment.
REFERENCES:
- Abbas, S., Peng, Q., Wong, M., Li, Z., Wang, J., Ng, K., Kwok,
C. Y. T., & Karena, K. (2021). Characterizing and classifying urban
tree species using bi-monthly terrestrial hyperspectral images in
Hong Kong. ISPRS Journal of Photogrammetry and Remote Sensing, 177,
204-216.
https://doi.org/10.1016/j.isprsjprs.2021.05.003
- Akhloufi, M. A., Couturier, A., & Castro, N. A. (2021). Unmanned
aerial vehicles for wildland fires: Sensing, perception, cooperation
and assistance. Drones, 5(1), 15.
https://doi.org/10.3390/drones5010015
- Barron, N. R., Didlake Jr, A. C., & Reasor, P. D. (2022).
Statistical analysis of convective updrafts in tropical cyclone
rainbands observed by airborne Doppler radar. Journal of Geophysical
Research: Atmospheres, 127(6), e2021JD035718.
https://doi.org/10.1029/2021JD035718
- Bin Chen, Bo Huang, Bing Xu. (2017). Multi-source remotely
sensed data fusion for improving land cover classification, ISPRS
Journal of Photogrammetry and Remote Sensing, Volume 124, 2017,
Pages 27-39, ISSN 0924-2716,
https://doi.org/10.1016/j.isprsjprs.2016.12.008
- Bishop-Taylor, R., Nanson, R., Sagar, S., & Lymburner, L.
(2021). Mapping Australia's dynamic coastline at mean sea level
using three decades of Landsat imagery. Remote Sensing of
Environment, 267, 112734.
https://doi.org/10.1016/j.rse.2021.112734
- BlackSwift Technologies. (2020). Working with NOAA to Improve
Situational Awareness and Operational Forecasting.
White Paper: Monitoring Tropical Cyclones with Unmanned Aircraft
Systems (UAS).
https://bst.aero/wp-content/uploads/2020/11/Hurricane-Observations-WP-30Nov2020.pdf
Cantou, J. (2018). High-resolution satellite imagery shared and
collective data source [Presentation]. EFGS Conference 2018.
Link
- Civil Engineering and Development Department (CEDD). (2016).
Natural Terrain Landslides Hazards in Hong Kong.
Link
- Civil Engineering and Development Department (CEDD). (2019).
Geotechnical Services. Geotechnical Control And Land Use Planning.
https://www.cedd.gov.hk/eng/our-major-services/geotechnical/index.html
- Civil Engineering and Development Department (CEDD). (2024).
Spatial Data Portal. Survey Division, CEDD.
https://sdportal.cedd.gov.hk/#/en/
- Charles de Jongh, Sara Pont, Julià Talaya. (2023). Mapping the
Catalan coast using airborne Lidar bathymetry. A vital step towards
effective coastal zone management. Hydro International.
https://www.hydro-international.com/content/article/mapping-the-catalan-coast-using-airborne-lidar-bathymetry
- Chesapeake Bay Program. (2023). Chesapeake Bay land use and land
cover (LULC) database 2022 edition: U.S. Geological Survey data
release.
https://doi.org/10.5066/P981GV1L
- China Centre for Resources Satellite Data and Application
(CASC). (2022). Land observation satellite emergency monitoring of
the 6.1-magnitude earthquake in Lushan County, Ya'an, Sichuan.
Link
- Choi, C. E., Ho, K. K., & Ng, C. W. (2018). Landslide risk
assessment: Size and mobility of landslides. Engineering Geology,
241, 188-194.
- Civil Aviation Administration of China (CAAC). (2018).
Low-altitude connected drone flight safety test report: B. Gradual
improvement in drone regulations.
Link
COGEO. (2024). Why Cloud Optimized GeoTIFF's? The advantages of
using COG's.
https://www.cogeo.org/why-cog.html
- Copernicus. (2024). Copernicus Data Access.
https://www.copernicus.eu/en/access-data
- CUHK. (2023). Press Release dated Sep 12, 2023. Satellite
technologies for flooding monitoring.
https://www.cpr.cuhk.edu.hk/en/press/satellite-technologies-for-flooding-monitoring/
- Dang, K. V., Nguyen, L. N., Nguyen, H. T., Le, T. T. H., Nguyen,
T. T. H., Nguyen, T. M. H., & Tran, D. X. (2022). Crop monitoring
strategy based on remote sensing data (Sentinel-2 and Planet): Study
case in a rice field after applying glycinebetaine. Agronomy, 12(3),
708.
https://doi.org/10.3390/agronomy12030708
- Digital Earth Africa. (2024). Analysis ready data.
https://www.digitalearthafrica.org/platform-resources/analysis-ready-data
- Drainage Services Department (DSD). (2017). Sponge city:
Adapting to climate change. Sustainability Report 2016-17.
https://www.dsd.gov.hk/Documents/SustainabilityReports/1617/en/sponge_city.html
- Department for Science, Innovation and Technology (DSIT).
(2012). Open standards principles.
https://www.gov.uk/government/publications/open-standards-principles/open-standards-principles
- Duong Van Hung. (2023, May 20). Drones for assessment of
disaster damage and impact - Revolutionizing disaster response.
United Nations Development Programme.
https://www.undp.org/vietnam/blog/drones-assessment-disaster-damage-and-impact-revolutionizing-disaster-response
- Earth Observation Data Hub (EODH). (2024). Aim of the EO
DataHub.
https://eodatahub.org.uk/wp-content/uploads/2024/06/EODH-Flyer-MVP_online.pdf
- Environmental Bureau (EB). (2021). Climate change adaptation and
resilience. Hong Kong's Climate Action Plan 2050.
https://www.eeb.gov.hk/sites/default/files/pdf/cap_2050_en.pdf
EROS Center. (2019). USGS EROS Archive - Earth Observing One (EO-1)
- Hyperion. U.S. Geological Survey.
https://www.usgs.gov/centers/eros/science/usgs-eros-archive-earth-observing-one-eo-1-hyperion
- ESRI. (2024). Earth Observation Explorer.
https://livingatlas2.arcgis.com/eoexplorer/
- EU Agency for the Space Programme. (2024). What is Earth
Observation?
https://www.euspa.europa.eu/eu-space-programme/copernicus/what-earth-observation
- European Commission. (2016). Space strategy for Europe:
Fostering entrepreneurship and new business opportunities.
https://ec.europa.eu/docsroom/documents/19442
- European Parliament, & Council of the European Union. (2014).
Regulation (EU) No 377/2014 of the
- European Parliament and of the Council of 3 April 2014
establishing the Copernicus Programme and repealing Regulation (EU)
No 911/2010. Clause 36. Official Journal of the European Union, L
122, 44-66.
- Food and Agriculture Organization of the United Nations (FAO).
(2023). Remote sensing determination of evapotranspiration –
Algorithms, strengths, weaknesses, uncertainty and best
fit-for-purpose. Cairo.
https://doi.org/10.4060/cc8150en
- Food and Agriculture Organization of the United Nations (FAO).
(2024). Land Cover and Land Use.
https://www.fao.org/geospatial/our-work/what-we-do/land-cover-and-land-use/en/
- Frazier, A. E., & Hemingway, B. L. (2021). A technical review of
Planet smallsat data: Practical considerations for processing and
using PlanetScope imagery. Remote Sensing, 13(19), 3930.
https://doi.org/10.3390/rs13193930
- Gaw, L. Y.-F., Yee, A. T. K., & Richards, D. R. (2019). A
high-resolution map of Singapore’s terrestrial ecosystems. Data,
4(3), 116.
https://doi.org/10.3390/data4030116
- Geotechnical Engineering Office (GEO). (2020). Enhanced Natural
Terrain Landslide Inventory (ENTLI).
https://www.ginfo.cedd.gov.hk/geoopendata/eng/ENTLI.aspx
- Geotechnical Engineering Office (GEO). (2021). Report No. 1/2024
on Landslip Prevention and Mitigation Studies and Works Carried out
by the Geotechnical Engineering Office
https://www.cedd.gov.hk/eng/our-projects/landslip/land_quar/index.html
- Greenwood, F., Nelson, E. L., & Greenough, P. G. (2020). Flying
into the hurricane: A case study of UAV use in damage assessment
during the 2017 hurricanes in Texas and Florida. PLOS ONE, 15(2),
e0227808.
https://doi.org/10.1371/journal.pone.0227808
- Guo, H., Liu, Z., Jiang, H., Wang, C., Liu, J., & Liang, D.
(2020). Big Earth Data analytics: A survey. Big Earth Data, 4(3),
295-338.
https://doi.org/10.1080/20933324.2020.1787805
- Guzzetti, F., Mondini, A. C., Cardinali, M., Fiorucci, F.,
Santangelo, M., & Chang, K. T. (2012). Landslide inventory maps: New
tools for an old problem. Earth-Science Reviews, 112(1-2), 42-66.
https://doi.org/10.1016/j.earscirev.2012.02.003
- Holbach, H. M., Bousquet, O., Bucci, L., Chang, P., Cione, J.,
Ditchek, S., Doyle, J., Duvel, J.-P., Elston, J., Goni, G., Hon, K.
K., Ito, K., Jelenak, Z., Lei, X., Lumpkin, R., McMahon, C. R.,
Reason, C., Sanabia, E., Shay, L. K., Sippel, J. A., Sushko, A.,
Tang, J., Tsuboki, K., Yamada, H., Zawislak, J., & Zhang, J. A.
(2023). Recent advancements in aircraft and in situ observations of
tropical cyclones. Tropical Cyclone Research and Review, 12(2),
81-99.
https://doi.org/10.1016/j.tcrr.2023.06.001
- HKSAR Government. (2020). CS visits Emergency Monitoring and
Support Centre [Press release].
https://www.info.gov.hk/gia/general/202008/19/P2020081900411.htm
- HKSAR Government. (2021). Government announces Hong Kong's
Climate Action Plan 2050. [Press release].
https://www.info.gov.hk/gia/general/202110/08/P2021100800588.htm
- HKSAR Government. (2021). Building a Liveable City. Striving
towards Carbon Neutrality before 2050. The Chief Executive's 2021
Policy Address. https://www.policyaddress.gov.hk/2021/eng/p95.html
- HKSAR Government. (2022). CEDD announces Study of Coastal
Hazards under Climate Change and Extreme Weather and Formulation of
Improvement Measures - Feasibility Study. [Press release].https://www.info.gov.hk/gia/general/202204/07/P2022040700422.htm?fontSize=1
- HKSAR Government. (2022). Small Unmanned Aircraft Order (Cap.
448G) to take full effect on December 1. [Press release].
https://www.info.gov.hk/gia/general/202211/30/P2022113000489.htm
- HKSAR Government. (2023). Chief Executive appoints Council for
Carbon Neutrality and Sustainable Development. [Press release].
https://www.info.gov.hk/gia/general/202304/28/P2023042800435.htm
- HKSAR Government. (2023). LCQ5: Government departments' work on
moving towards carbon neutrality.
https://www.info.gov.hk/gia/general/202305/10/P2023051000407.htm
- HKSAR Government. (2024). Climate Change in Hong Kong.
https://www.gov.hk/en/residents/environment/global/climate.htm
- HKSAR Government. (2024). Hong Kong Real-time Tide Information
Service.
https://www.gov.hk/en/residents/transport/vessel/realtime_tide.htm
- Hong Kong Observatory. (2020). TROPICAL CYCLONES IN 2018.
https://www.hko.gov.hk/en/publica/tc/files/TC2018.pdf
- Hong Kong Observatory. (2024). Climate Change in Hong Kong -
Extreme weather events.
https://www.hko.gov.hk/en/climate_change/obs_hk_extreme_weather_info.htm
- Hong Kong Observatory. (2024). Climate change in Hong Kong -
Mean sea level.
https://www.hko.gov.hk/en/climate_change/obs_hk_sea_level.htm
- Hong Kong Observatory. (2024).
The Year's Weather – 2023.
- Hong Kong Observatory. (2024). TROPICAL CYCLONES IN 2023.
https://www.hko.gov.hk/en/publica/tc/files/TC2023.pdf
Disclaimer:
This publication / website / product / service contains information that
is copied or extracted from data made available in the publications of
the Hong Kong Observatory (the "Observatory"). The provision of the
information copied or extracted from the Observatory's publications
shall not be constituted as any form of co-operation or affiliation by
the Observatory with any person in relation to this publication /
website / product / service or any contents herein. Nothing in this
publication, the product or the service shall give rise to any
representation, warranty or implication that the Observatory agrees
with, approves of, recommends or endorses this publication / website /
product / service. The Observatory does not have any liability,
obligation or responsibility whatsoever for any loss, destruction or
damages (including without limitation consequential loss, destruction or
damages) howsoever arising from or in respect of your use or misuse of
or reliance on or inability to use any contents herein.
- Hou, C., Liu, Z., Chen, Y., Wang, S., & Liu, A. (2023). Tree
species classification from airborne hyperspectral images using
spatial–spectral network. Remote Sensing, 15(24), 5679.
https://doi.org/10.3390/rs15245679
- IGN FI. (2024). Upgrading of the general map, Burkina Faso.
https://www.ignfi.fr/en/portfolio-item/cartographie-burkina-faso/
- IPCC. (2021). Summary for policymakers. In V. Masson-Delmotte,
P. Zhai, A. Pirani, S. L. Connors, C. Péan, S. Berger, N. Caud, Y.
Chen, L. Goldfarb, M. I. Gomis, M. Huang, K. Leitzell, E. Lonnoy, J.
B. R. Matthews, T. K. Maycock, T. Waterfield, O. Yelekçi, R. Yu, &
B. Zhou (Eds.), Climate change 2021: The physical science basis (pp.
3−32). Cambridge University Press.
https://doi.org/10.1017/9781009157896.001
- Irons, J. R., Dwyer, J. L., & Barsi, J. A. (2012). The next
Landsat satellite: The Landsat Data Continuity Mission. NASA
Publications, 61.
https://digitalcommons.unl.edu/nasapub/61
- Ishiwatari, M. (2024). Leveraging drones for effective disaster
management: A comprehensive analysis of the 2024 Noto Peninsula
earthquake case in Japan. Progress in Disaster Science, 23, 100348.
https://doi.org/10.1016/j.pdisas.2024.100348
- Jaboyedoff, M., Oppikofer, T., Abellán, A., Derron, M. H., Loye,
A., Metzger, R., & Pedrazzini, A. (2012). Use of LIDAR in landslide
investigations: A review. Natural Hazards, 61(1), 5-28.
- Johnson, G. C., & Lumpkin, R. L. (Eds.). (2024). Global oceans,
State of the Climate in 2023. Bulletin of the American
Meteorological Society, 105(8), S156–S213.
https://doi.org/10.1175/BAMS-D-24-0100.2
- K.C. Ng, H.Y. Ho & K. J. Roberts (2018).
Evolution of Natural Terrain Hazard Assessment Strategy in Hong Kong.
- Kakiuchi, H. (2002).
Study for Establishment of National Basic Geographic Data in The
Republic of El Salvador.
- Kwong, Ivan H. Y., Frankie K. K. Wong, Tung Fung, Eric K. Y.
Liu, Roger H. Lee, and Terence P. T. Ng. (2022). A Multi-Stage
Approach Combining Very High-Resolution Satellite Image, GIS
Database and Post-Classification Modification Rules for Habitat
Mapping in Hong Kong. Remote Sensing 14, no. 1: 67.
https://doi.org/10.3390/rs14010067
- Kääb, A., Altena, B., & Mascaro, J. (2021). Coseismic
displacements of the 14 November 2016 Mw 7.8 Kaikoura, New Zealand,
earthquake using the Planet optical cubesat constellation. Natural
Hazards and Earth System Sciences, 21(2), 559-574.
- Köster, S. (2021). How the sponge city becomes a supplementary
water supply infrastructure. Water-Energy Nexus, 4, 35-40.
https://doi.org/10.1016/j.wen.2021.02.002
- Lands Department (LandsD) (2024). Aerial Photographs
https://www.landsd.gov.hk/en/survey-mapping/mapping/aerial-photo-photogrammetric-products/aerial-photo.html
- Lato, M. J., Hutchinson, D. J., Gauthier, D., Edwards, T., &
Ondercin, M. (2015). Comparison of airborne laser scanning,
terrestrial laser scanning, and photograph photogrammetry for
rockface characterization at an active quarry. Geomorphology, 235,
96-105.
- Marinelli, F., & Guzzi, R. (2019). The Future of Hyperspectral
Imaging. Journal of Imaging, 5(11), 84.
https://doi.org/10.3390/jimaging5110084
- Marston, C., O'Neil, A. W., Morton, R., Wood, C., & Rowland, C.
(2023). LCM2021 - The UK Land Cover Map 2021. Earth System Science
Data, 15, 4631-4649.
https://doi.org/10.5194/essd-15-4631-2023
- Maxar Technologies Inc. (Maxar). (2022). Future-proof you Telco
Networks with Next-Gen 3D Geodata.
https://resources.maxar.com/white-papers/30008-20-20white-20paper-20-20telco
- Maxar Technologies Inc. (Maxar). (2024). Open Data Program.
Satellite imagery for select sudden onset major crisis events.
https://www.maxar.com/open-data
- Microsoft Corporation Inc. (Microsoft). (2024). About the
Microsoft Planetary Computer.
https://planetarycomputer.microsoft.com/docs/overview/about/
- Naethe, P., De Sanctis, A., Burkart, A., Campbell, P. K. E.,
Colombo, R., Di Mauro, B., Damm, A., El-Madany, T., Fava, F., Gamon,
J. A., Huemmrich, K. F., Migliavacca, M., Paul-Limoges, E., Rascher,
U., Rossini, M., Schüttemeyer, D., Tagliabue, G., Zhang, Y., &
Julitta, T. (2024). Towards a standardized, ground-based network of
hyperspectral measurements: Combining time series from autonomous
field spectrometers with Sentinel-2. Remote Sensing of Environment,
303, 114013.
- National Oceanic and Atmospheric Administration (NOAA). (2012).
Lidar 101: An introduction to lidar technology, data, and
applications. NOAA Coastal Services Center.
https://coast.noaa.gov/data/digitalcoast/pdf/lidar-101.pdf
- Natural Resources Canada. (2023). High resolution digital
elevation model (HRDEM) – CanElevation series – Product
specifications (Edition 1.5).
Link
- Nederhoff, K., Crosby, S. C., Van Arendonk, N. R., Grossman, E.
E., Tehranirad, B., Leijnse, T., Klessens, W., & Barnard, P. L.
(2024). Dynamic modeling of coastal compound flooding hazards due to
tides, extratropical storms, waves, and sea-level rise: A case study
in the Salish Sea, Washington (USA). Water, 16(2), 346.
https://doi.org/10.3390/w16020346
- NG T.K., NG N.H. (2024). Semantic Segmentation-Based Study of
Solar Panel Footprints in Hong Kong.
https://fig.net/resources/proceedings/fig_proceedings/fig2024/papers/ts12g/TS12G_ng_ng_12687.pdf
- Nichol, J. E., & To, P. H. (2012). Temporal characteristics of
thermal satellite images for urban heat stress and heat island
mapping. ISPRS Journal of Photogrammetry and Remote Sensing, 74,
153-162.
https://doi.org/10.1016/j.isprsjprs.2012.09.007
- NOAA Office for Coastal Management. (2023). Frequent questions:
United States Interagency Elevation Inventory.
https://coast.noaa.gov/data/docs/digitalcoast/inventory/faq.pdf
- Pixxel. (2024). Hyperspectral Imagery.
https://www.pixxel.space/hyperspectral-imagery
- Planet Labs PBC. (2024). Planet launches first Tanager-1
hyperspectral satellite and 36 SuperDoves with SpaceX.
https://www.planet.com/pulse/planet-launches-first-tanager-1-hyperspectral-satellite-and-36-superdoves-with-spacex/
- Planet Labs PBC. (2024). Respond to natural and human-made
disasters.
https://www.planet.com/disasterdata/#get-started
- Prakash, M., Ramage, S., Kavvada, A., & Goodman, S. (2020). Open
Earth observations for sustainable urban development. Remote
Sensing, 12(10), 1646. https://doi.org/10.3390/rs12101646
- Razak, K. A., Straatsma, M. W., van Westen, C. J., Malet, J. P.,
& de Jong, S. M. (2011). Airborne laser scanning of forested
landslides characterization: Terrain model quality and
visualization. Geomorphology, 126(1-2), 186-200.
- Remote Sensing Laboratory. (2024). Land use and land cover
mapping of Pearl River Delta region and Hong Kong.
http://www.lsgi.polyu.edu.hk/rsl/landcover.html
- Ren, H. C., Yan, Q., Liu, Z. J., Zuo, Z. Q., Xu, Q. Q., Li, F.
F., & Song, C. (2016). Study on analysis from sources of error for
Airborne LIDAR. IOP Conference Series: Earth and Environmental
Science, 46, 012030.
https://doi.org/10.1088/1755-1315/46/1/012030
- Smith, J., Davis, L., & Johnson, M. (2020). Advances in
high-resolution Earth observation for the 21st century. Remote
Sensing of Environment, 248, 111935.
- Survey and Mapping Office, LandsD (SMO). (2024). Determination
of slope maintenance responsibility.
https://www.landsd.gov.hk/en/land-mgt-enforce/slope-maintenance-responsibility.html
- U.S. Congress. (2015). U.S. Commercial Space Launch
Competitiveness Act, Pub. L. No. 114-90, 129 Stat. 704.
- United Nations General Assembly. (1986). Resolution 41/65:
Principles relating to remote sensing of the Earth from space.
https://www.unoosa.org/oosa/en/ourwork/spacelaw/principles/remote-sensing-principles.html
- Vaglio Laurin, G., Cotrina-Sanchez, A., Belelli-Marchesini, L.,
Tomelleri, E., Battipaglia, G., Cocozza, C., Niccoli, F., Kabala, J.
P., Gianelle, D., Vescovo, L., Da Ros, L., & Valentini, R. (2024).
Comparing ground below-canopy and satellite spectral data for an
improved and integrated forest phenology monitoring system.
Ecological Indicators, 158, 111328.
https://doi.org/10.1016/j.ecolind.2023.111328
- Wang, Z., & Menenti, M. (2021). Challenges and opportunities in
lidar remote sensing. Frontiers in Remote Sensing, 2, Article
641723.
https://doi.org/10.3389/frsen.2021.641723
- Wang, Junbo, Lanying Wang, Shufang Feng, Benrong Peng, Lingfeng
Huang, Sarah N. Fatholahi, Lisa Tang, and Jonathan Li. (2023). "An
Overview of Shoreline Mapping by Using Airborne LiDAR." Remote
Sensing 15, no. 1: 253.
https://doi.org/10.3390/rs15010253
- World Meteorological Organization. (2024). State of the global
climate 2023 (WMO-No. 1347).
https://library.wmo.int/idurl/4/68835
- WSP. (2024). Consultancy study on use of sponge city concepts
and technologies for Hong Kong government buildings. WSP.
https://www.wsp.com/en-hk/projects/consultancy-study-on-use-of-sponge-city-concepts-and-technologies-for-hong-kong-government-buildings
- Xie, D., Zou, Q.-P., Mignone, A., & MacRae, J. D. (2019).
Coastal flooding from wave overtopping and sea level rise adaptation
in the northeastern USA. Coastal Engineering, 150, 39-58.
https://doi.org/10.1016/j.coastaleng.2019.02.001
- Yang, K., Yan, L., Huang, G., Chen, C., & Wu, Z. (2016).
Monitoring building deformation with InSAR: Experiments and
validation. Sensors, 16(12), 2182. https://doi.org/10.3390/s16122182
- Yang, L., Jin, S., Danielson, P., Homer, C., Gass, L., Bender,
S. M., Case, A., Costello, C., Dewitz, J., Fry, J., Funk, M.,
Granneman, B., Liknes, G. C., Rigge, M., & Xian, G. (2018). A new
generation of the United States National Land Cover Database:
Requirements, research priorities, design, and implementation
strategies. ISPRS Journal of Photogrammetry and Remote Sensing, 146,
108-123.
https://doi.org/10.1016/j.isprsjprs.2018.09.006
- Yokoya, N., Xia, J., & Broni-Bediako, C. (2024). Submeter-level
land cover mapping of Japan. International Journal of Applied Earth
Observation and Geoinformation, 127, 103660.
https://doi.org/10.1016/j.jag.2024.103660
- Zhao, J., Wu, J., Ding, X., Zhang, L., & Hu, F. (2016). Analysis
of multipath pixels in SAR images. ISPRS - International Archives of
the Photogrammetry, Remote Sensing and Spatial Information Sciences,
XLI-B7, 873–877.
https://doi.org/10.5194/isprs-archives-XLI-B7-873-2016
- Zheng, C., Jia, L., & Hu, G. (2022). Global land surface
evapotranspiration monitoring by ETMonitor model driven by
multi-source satellite earth observations. Journal of Hydrology,
613(Part B), 128444.
https://doi.org/10.1016/j.jhydrol.2022.128444
BIOGRAPHICAL NOTES
Sr Nok-hang NG is a Land Surveyor working in Hong Kong. He is a
council member of Land Sureying Division of Hong Kong Institute of
Surveyors.
CONTACTS
Sr Nok-hang NG
The Hong Kong Institute of Surveyors
111 Connaught Rd Central, Sheung Wan
HONG KONG SAR,
CHINA
Tel. +852 2526 3679
Web site: https://www.hkis.org.hk/en/index.html


