Article of the Month -
August 2018
|
Alternative Approach and toolkits for
Economic Valuation of Ecosystem Services of Wetlands: An Application to
Farlington Marshes, UK
Carlos BRETT, Venezuela and Isaac BOATENG,
United Kingdom
This article has passed the FIG peer review and was presented at the
FIG Congress 2018 in Istanbul, Turkey. Despite the relevance of wetlands
there is no generally accepted methodology for the economic valuation of
ecosystem goods and services of wetlands.This paper attempts to develop
an alternative holistic approach.
This article in .pdf-format
(18 pages)
SUMMARY
Wetlands offer a wide variety of ecosystem goods and services, such
as fisheries, agriculture, tourism and regulatory functions that benefit
human society. Despite this relevance, there is no generally accepted
methodology for the economic valuation of ecosystem goods and services
of wetlands. The existing methodologies for the valuation of ecosystem
goods and services rely on revealed preference approach (willingness to
pay and travel cost) due to lack market prices for most of the services.
They do not provide actual value of ecosystem goods and services,
because it is inferred from users’ opinion and willingness rather than
the actual benefit or services derived from the ecosystem. In addition,
they lack simple resources and tools in order to make them user-friendly
for surveyors and researchers assessing ecosystem services value. This
paper attempts to develop an alternative holistic approach for the
valuation of ecosystem good and services. The methodology includes
fieldwork, case study and assessment of actual market values for each
ecosystem goods and services, and application of opportunity cost where
market values could not be ascertained. The results provide a realistic
and evidence-based value to inform sustainable exploitation and
management of wetlands. The paper concludes by advocating for the
acceptance of this evidence-based valuation methodology for the economic
valuation of ecosystem goods and service.
1. INTRODUCTION
Wetlands are defined by the Ramsar Convention as “areas of marsh,
fen, peatland or water, whether natural or artificial, permanent or
temporary, with water that is static or flowing, fresh, brackish or
salt, including areas of marine water the depth of which at low tide
does not exceed six metres”, including as well “riparian and coastal
zones adjacent to wetlands, and islands or bodies of marine water deeper
than six metres at low tide lying within the wetlands” (Ramsar
Convention Secretariat 2013). The Ramsar classification comprises 42
types of wetlands grouped into three categories that are Inland
wetlands, Marine/coastal wetlands and Human-made wetlands (Ramsar
Convention Secretariat 2013).
Wetlands are valuable ecosystems that offer a very important range of
EGS, including economic and ecosystem benefits such as water supply and
water quality regulation (e.g. filtration pollutants and cycling of
nutrients); ecosystem and landscape modelling features (e.g. protection
against storms and floods, specific vegetation with relevant ecological
functions, etc.); fisheries (around two thirds of the world’s fisheries
depends directly or indirectly on the good performance of the wetlands);
agriculture services such as grazing areas or the availability of water
for crop maintenance; provisioning of energy by peat and plant matter;
biodiversity and wildlife resources; transport; and recreation and
tourism opportunities (Ramsar Convention Secretariat 2013). They also
play an important role in terms of the cultural heritage of humanity, as
they are “linked to religious and cosmological beliefs, constitute a
source of aesthetic inspiration, provide wildlife sanctuaries, and form
the basis of important local traditions” (Barbier et al. 1997; Russi et
al. 2013).
In the UK, 693 coastal wetlands are estimated to cover 274,613
hectares of the territory and they offered services projected to be
valued between £510 and £786 million per year, with an average
contribution per year per hectare estimated to be £1,856 (Morris and
Camino 2011). The provisioning of ecosystem services is supplied at
various spatial and temporal scales, which has a strong impact on the
value different stakeholders attach to the services (Hein et al. 2006).
EGS is also bound to the fate of the ecological processes of wetlands,
as shown in the function-benefit interactions scheme presented by Defra
(2007) (Figure 1). Therefore, it is very important to care about and
keep track of the uses of wetlands, in order to prevent potential harm,
abuse or negligent activities are taking place. Such destructive
activities might compromise the whole performance of the habitats with
strong socio-economic and ecological consequences. The assessment of the
EGS of wetlands is an important area already covered by several studies
(Barbier et al. 1997; Hein et al. 2006; Ghermandi et al. 2010; Morris
and Camino 2011; Barbier et al. 2013; Liquete et al. 2013).
Nevertheless, more efforts are required to increase our knowledge of
wetlands and this includes carrying out the valuation of unknown areas
and the development holistic easy-to-use tools and frameworks to aid,
improve and encourage actual/alternative EGS valuation (Brett et al.
2015).
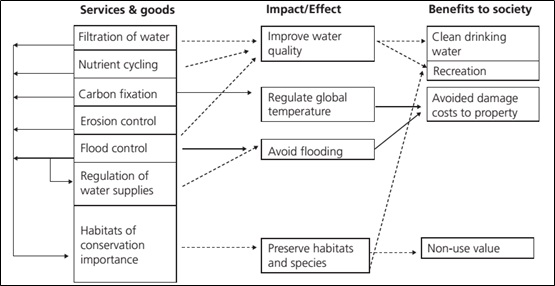
Figure 1. Wetland function-benefit interactions scheme (Defra 2007)
The ecosystem goods and services (EGS) could be defined as the range
of benefits delivered by nature, that is directly or indirectly
harnessed by humankind (De Groot et al. 2002). This includes actual
tangible goods such as alimentary and mineral resources and “intangible”
benefits such as environmental-regulative functions and cultural
influence and affection.
The economic extrapolations of the EGS are useful for the estimation of
the economic value of the natural resources and processes. There are
several ways to make these extrapolations. These include direct methods
based on commercial indicators (e.g. market values, industrial
productivity rates and users’ consumption rate), and indirect methods
based on revealed preference - hypothetical-qualitative considerations
and indicators (e.g. contingent valuation, polls and quizzes, affection,
willingness to pay and willingness to protect the resource) (Ledoux and
Turner 2002). Thanks to these methods we have a better comprehension of
the economic implications of different environmental features and
processes that serve as a protection shield against extreme climatic
events such as storms and flooding (Pert et al. 2012; Barbier et al.
2013; Camacho-Valdez et al. 2013). They also facilitate our ability to
estimate how valuable these environmental features are for the regular
operation of major economic activities such as fisheries, hunting,
tourism and mining (Remoundou et al. 2009; Perni et al. 2011;
Camacho-Valdez et al. 2013).
In addition to these, it is important to note that despite the intrinsic
ecological value of the ecosystems, the economic assessment derived from
the EGS valuation is an important resource to inform management policies
and responsibilities, as it provides additional information that is
useful for decision making as well as raising of awareness in certain
social sectors (Bockstael et al. 1995; Hueting et al.1998; De Groot et
al. 2002; Ahmed & Gotoh 2006; Fisher et al. 2009).
However, there is no commonly agreed to standardise approach for the
accounting and extrapolations for economic value EGS (Boyd & Banzhaf
2007). In fact, different schemes with diverse approaches are rife. Some
of them focusing on economic aspects (Barbier et al. 1997; Ledoux
& Turner 2002), others on ecological-functional features (De Groot et
al. 2002; Remoundou et al. 2009; Potts et al. 2014). There are others
with mixed characteristics (Bockstael et al. 1995; Barbier et al. 1997;
Hueting et al. 1998; De Groot et al. 2002; Liquete et al. 2013; Potts et
al. 2014). All these approaches do not provide the actual value of EGS
of wetlands because they are mostly based upon users’ willingness to pay
or protect, which tend to be influenced by users purchasing power rather
than a more objective value of the EGS.
Some authors and relevant institutions have suggested the need for
unified approaches and frameworks in order to improve uncertainties in
the valuation, management and research in EGS (Kubiszewski et al. 2017;
Hammel & Bryant 2017. UK DEFRA report by Christie et al. (2011) proposed
a holistic framework to conduct an EGS assessment. The United States
Environmental Protection Agency website also provides resources such as
the Causal Analysis/Diagnosis Decision Information System (CADDIS)
(USA's EPA 2012), and Landers and Nahlik (2013) offered the Final
Ecosystem Goods and Services Classification System (FEGS-CS).
Nevertheless, all these approaches might be lacking certain qualities or
just need a better divulgation as they are not based on the actual
values of specific EGS. Therefore, more efforts are still necessary to
create more holistic and user-friendly approach to facilitate the
assessment and valuation of EGS. Nonetheless, the fight to reduce the
impacts of climate change and associated global agreement on carbon cost
to polluters, the improved awareness of the importance to protect
wetlands, and the detailed classification and usage of ecosystem goods
and services have moved society closer to the marketization of more
non-market goods and services of wetlands. These have made it possible
to develop an alternative valuation approach, which is holistic and
facilitate the estimation of the actual value of EGS. This paper
attempt to provide a more holistic approach, which provides a valuation
of EGS based upon actual estimated values of goods and services from a
particular wetland.
2 MATERIAL AND METHODS
2.1 The case study area
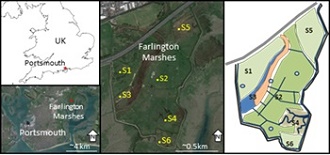
Farlington Marshes is a wetland located in Portsmouth, on the south
coast of England (Figure 2). The wetland is a coastal grazing marsh that
may be categorised as a “Marine intertidal marsh” according to the
RAMSAR classification scheme (RAMSAR 2010, p80). The territory was
originally reclaimed from the sea in the late 18th century, when a clay
and timber wall was built across the mudflats, linking the natural
islands that were previously occupying part of the Langstone Harbour
(Hampshire & Isle of Wight Wildlife Trust (HIWWT) (n.d). Currently it is
a 1,117,348 m2 wetland (~276.11 acres) enclosed by a concrete
barrier with a floodgate inlet controlling the amount of seawater
allowed into the main lagoon, and features different traits such as two
lagoons, reed bed patches, grazing meadows, several ponds, a network of
channel and streams, comprising both fresh and brackish water bodies.
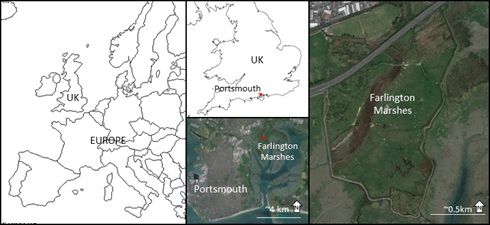
Figure 2. Location of Farlington Marshes (Coordinates 50°49'58.13" N,
1°01'36.26"E)
The EGS offered by this wetland in general terms, come by means of
recreational areas for local people and internationally important
habitats for winter migrant waders such as Brent geese and black-tailed
godwits, coastal grazing marsh habitat (a very rare habitat in this
region), hay meadows (grasslands), and the network of channels and
waterways. It is covered by various national conservation designations.
It is part of the Special Protection Area (SPA) of “Chichester and
Langstone Harbours” and the Special Area of Conservation (SAC) of the
“Solent and Isle of Wight Lagoons”, part of the Ramsar site “Chichester
and Langstone Harbours”, part of the Site of Special Scientific Interest
(SSSI) of “Langstone Harbour”, and a Local Natural Reserve (LNR) by
itself, called Farlington Marshes” (HIWWT n.d). These designations are
assigned because of its special features, such as the salt marsh, fresh
marsh, lagoon, reed beds, grassland, scrub and habitat for migratory
birds.
Management and the cost of maintaining the site are met by HIWWT, a
charity organisation, which relies on membership and donations from the
public. They also receive money from Natural England. In addition, there
are committed volunteer team that work on the site. Together with the
reserve officers, they carry out the majority of the practical
conservation work to maintain the habitats in the reserve.
In terms of scientific coverage, there is limited literature available
online about this site. Approximately, 101 online articles mentioned the
name “Farlington Marshes”, but only one addresses the shoreline
management challenge of Farlington Marshes directly as a case study
(Esteves et al. 2012). Most of the official information can be found
through the HIWWT website, local news and direct contact with the
managers. For this reason, this paper which, addresses the topic of EGS
assessment of Farlington Marshes, could be identified as the first
economic valuation of EGS to provide useful information for the local
managers and policymakers.
2.2. Alternative Ecosystem Services Valuation Approach
The Alternative Ecosystem Services Valuation Approach (AESVA), is a
holistic method for the assessment of the economic value of EGS of
wetlands. The approach is two-prong. The first part presents details of
the tools that have been developed for field survey, characterisation
and valuation of EGS, together with an explanation of the application of
the tools. The second part presents the specific details on the
application of the approach to the case study area (Farlington Marshes).
The development of this methodology required the definition of
conceptual criteria that would be used to describe and classify the EGS.
The approach is developed based upon previous knowledge from Brett et
al. (2015); Liquete et al. (2013); De Groot et al. (2002); Wilson et al.
(2005) and Russi et al. (2013). Knowledge from these authors was used as
the foundation for the development of the scheme for AESVA (Table 1).
This integrated scheme helps the user to have a better understanding of
the relation between ecosystem functions and offered services, as it
provides an actual list with the main EGS offered by wetlands and
therefore allows the translation between the different classification
systems, thus making it easier to assign/identify the right categories
(when adding new case-specific EGS to the existing list). It also
facilitates the realisation of future aggregations and analysis
according to the necessities of the user (e.g. management and
policy-making, scientific analysis and general information gathering).
The AESVA procedures and resources (Figure 3) that have been developed
are available as templates and spreadsheets to be used or applied by the
professionals interested in applying this approach.
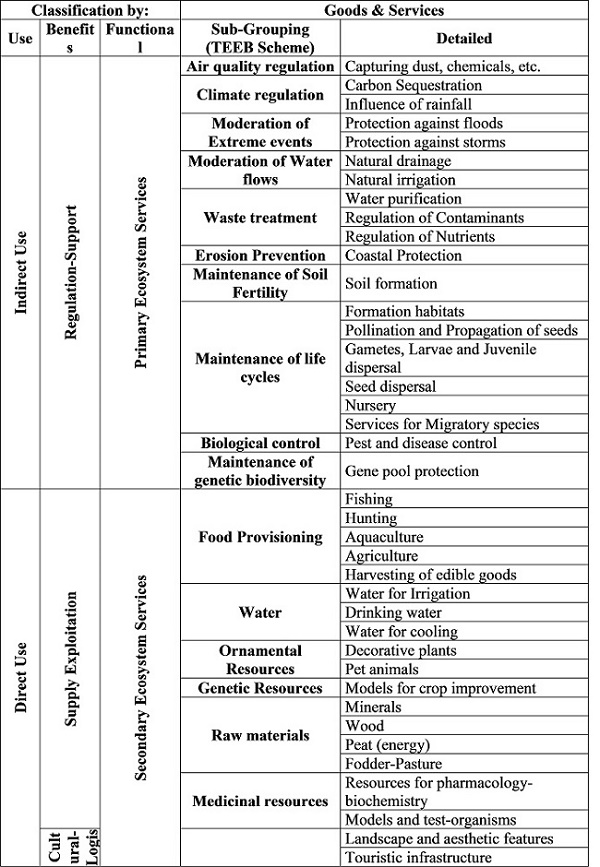
Table 1. A comprehensive classification scheme for the ecosystem
goods and services. (After Brett et al. 2015 and Liquete et al. 2013).
Note that the categories included here serve as a general framework, and
more categories could be added to the detailed column if additional
services are found in a study area.
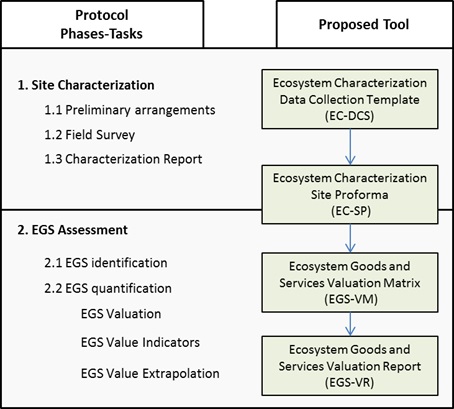
Figure 3. Diagram illustrating the AESVA, specifying the order of the
tasks and the tools developed for each phase
2.3 Site Characterization
As shown in Figure 3, the methodology suggests that data collection
could be done in two phases. The first phase is to assess the general
characteristics of the ecosystem and to identify the various goods and
services. The second phase (quantification phase) is to acquire the
values of the economic parameters for the valuation of the EGS. For each
phase, specific resources have been developed to provide standardised
tools to make the assessment easier for the application of this
methodology.
The assessment of the general characteristics of the ecosystem focuses
on key features such as geomorphology, physical processes, geology,
biodiversity, management issues and initial assessment of EGS. For this
purpose, the “Ecosystem Characterization Data Collection Sheet” (EC-DCS)
(Figure 4) was developed as a fillable template comprising some
essential information, field checklists and reference maps. The
comprehensive classification of EGS, management and diversity checklist
is also required (Table in Figure 4.2). This list should be compiled
during the pilot survey. These two field data collection tools cover the
detailed information that could be gathered from the field to provide an
integral description of the site, the spatial relevance (Hein et al.
2006), classification of EGS, management issues and diversity of the
wetland. Note that this form is a suggestion and the fields could be
modified or added as desired (e.g. water chemistry parameters), as long
as the surveyor is able to gather that information. Following the field,
the survey is the processing of the filed data from EC-DCS, into a
written description of each site using the “Ecosystem Characterisation
Site Proforma” template (EC-SP) (Table not included). This is the final
product of the general characterisation. The EC-SP template comes with
different sections addressing important aspects that should be of
general interest while trying to understand the main ecological and
socio-economical characteristics of an ecosystem. Depending on the scale
of the project and design of the survey, the site Proformas may feature
as a table summarising the EGS offered by the assessed ecosystem.
Moreover, where multiple sites are assessed, Table 2 may include a final
column with a total significance index (TSI) for each EGS category (See
Formula 1), as an additional aid to quantify how significant is each EGS
category for the whole ecosystem. It should be noted that this is a
quantitative aid for a qualitative parameter, as the real economic
significance should be assessed with actual economic data in the next
phases of the methodology. The proposed index is a value between 0 and
100, and it can be interpreted like this: zero implies that the EGS is
not existent in the wetland, lower values suggest that the EGS is
present in just a few sites or that it is not properly developed and
higher values imply that the EGS is fully developed in most of the
sites.
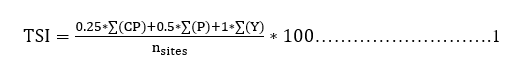
Where “TSI” is total significance index (the index is calculated for
each EGS category), and the sums brackets in the numerator correspond to
the number of sites in which the addressed EGS category where classified
as “CP”, “P” and “Y”, where “CP” is EGS conditionally potential, “P” is
EGS potentially applicable and “Y” means EGS present. Therefore, each of
these values (“CP”, “P” and “Y”) could range between zero and the total
number of sites. The remaining categories (Not present “N” and Unknown
status “U”) are not included in the formula as they do not add
significance to the EGS. Then, each summation will be multiplied by the
assigned fixed constant (0.25, 0.5, and 1.0 respectively); then, the
nominator will be divided by the number of sites (nsites), and then
multiplied by 100. For a visual aid, colours could be assigned to the
following ranks of values: red (0), orange (1-30), light green (31-70),
dark green (71-100) (see an example later in Table 8).
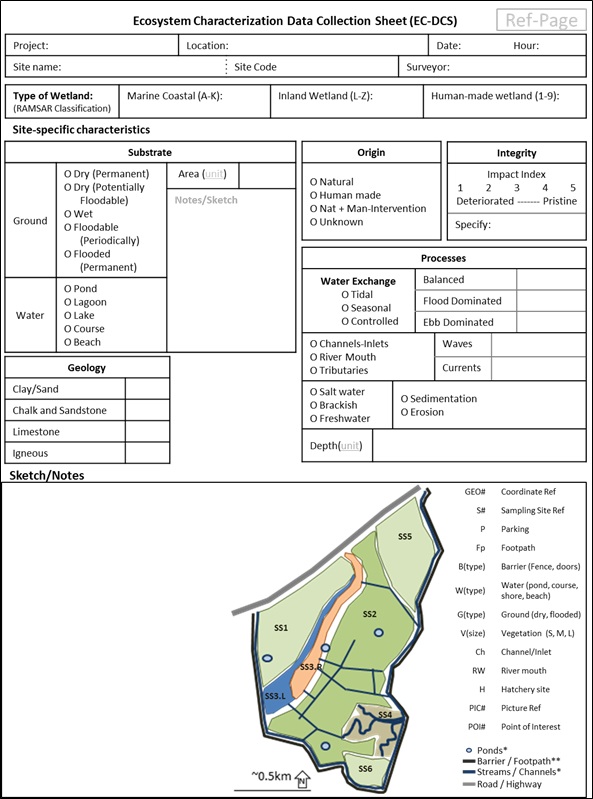
Figure 4.1 Ecosystem characterization data collection sheet (template
EC-DCS). Side A
The map is referential from this Project.
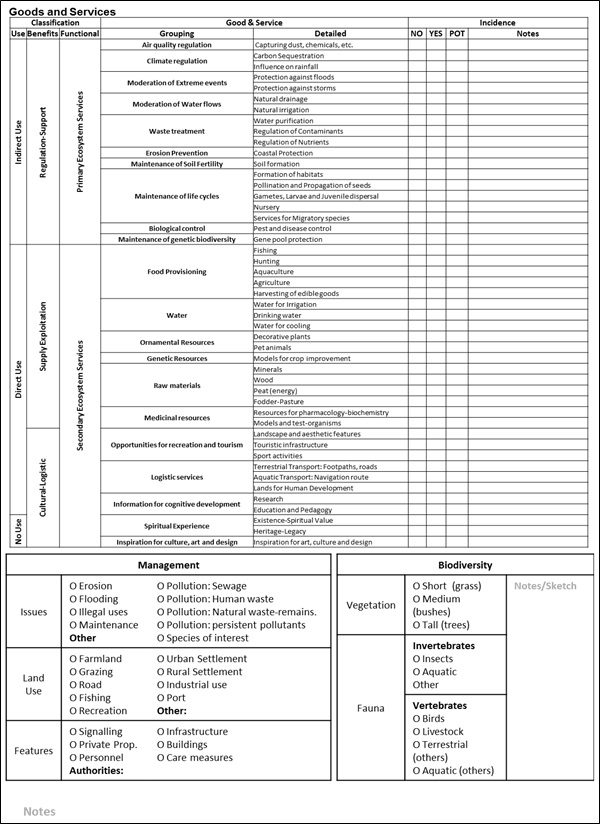
Figure 4.2 Ecosystem characterization data collection sheet (template
EC-DCS). Side B
2.4 EGS valuation
The EGS valuation estimates the total economic value of the ecosystem
in terms of the specific EGS assessed in a specific ecosystem. The
general assessment carried out in the first phase focus on identifying
the potential EGS that should be considered for each site. This
assessment should be done focusing on the evidence available on the
field through a field surveys (e.g. signs of human activity, and
evidence of key services provided by the ecosystem). In addition,
previous knowledge and data of the study area obtained from local
authorities should be considered. The next step is to confirm and
quantify the economic values of the significant EGS identified on the
site, which requires estimating the values of specific parameters. The
estimate could be the actual market value already defined for the
assessed EGS (Kalay et al. 2014; Imberman & Lovenheim 2013), comparative
value of EGS that are similar (Costanza et al. 2014), opportunity cost
of providing the same benefit on assumption of “what if” scenario
(Holland et al. 2016) and the restoration or replacement cost, which is
based on assumption of a loss/damage of the actual EGS.
For this quantification phase, the first proposed tool is the “Ecosystem
Goods and Services Valuation Matrix” (EGS-VM) (Table, not included),
which is an interactive spreadsheet where the user can put in the
economic values of the assessed EGS categories. This spreadsheet is
designed in a smart way that allows advantages such as the inclusion of
the contribution per area unit (e.g. £/hectare) and the automatic
estimation of the total value, the fixed contribution for the whole area
(e.g. a fixed value such as land value) or the variable contribution
(e.g. yearly rates of contribution as £/year). It should be noted that
the formulas (Figure 5) and the cells of this spreadsheet are easily
adaptable. It allows users to freely change the proposed layout and
adjust it to their own necessities.
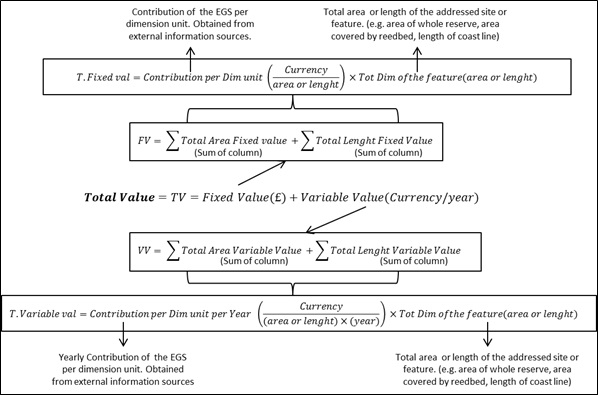
Figure 5. Set of formulas to estimate the Total Economic Value of the
Ecosystem
Note: T=total, val=value, dim=dimension, FV=Fixed Value, VV= Variable
Value
Despite its adaptability, the EGS-VM may be too complex or too big for
understanding by some users, and this is why the AESVA suggest that it
should be translated into a compact “Ecosystem Goods and Services
Valuation Report” (EGS-VR) (Table 2), where the economic value of the
addressed ecosystem could be grouped into different aggregation
categories (e.g. by type of economic indicator (fixed values, variable
values). Once again, this adaptable resource could be modified to meet
the terms and the interest of the user.
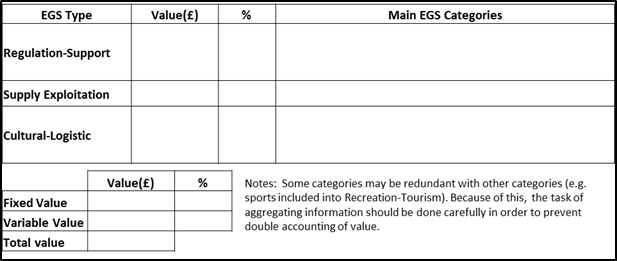
Table 2. Ecosystem goods and services valuation report (template EGS-VR).
2.5 Application of AESVA to the Farlington Marshes
The approach was tested at the Farlington Marshes to fine-tune the
toolkits and the application procedures. It was also to assess the
viability of the approach. Farlington Marshes” was identified to be a
suitable place to test this approach because of its convenient location
and relatively limited valuation research coverage. The application of
this approach was carried out as a project called Farlington Marshes
Ecosystem Value Assessment” (FAMEVA).
The project aim was to use the AESVA to assess the EGS offered by
Farlington Marshes, taking into consideration the different features and
characteristics of the wetland. For the purpose of this assessment the
area was divided into nine distinctive sections (Figure 6) based
on different identifiable features: the bush (S1), the main marsh (S2),
the lake with its reedbed (S3-L and S3-R), the ramified lagoon called
“the deeps” (S4), the hay field (S5), the point field (S6), the ponds
and pools in the whole area (S-PP), the channels-streams (S-CS), and the
barrier-footpaths (S-BF).
During the elaboration of the nine sampled sites into site Proformas,
some changes were made in order to simplify the comprehension and to
prevent excessive repetitive analysis. The modifications include the
introduction of a whole-area proforma summarising the general
characteristics of the whole wetland (an example of whole-area proforma
of the case study is presented in Table 7. In addition, joint proformas
and analysis of some sites that featured similar traits were also
considered.
For the purpose of EGS valuation/quantification, efforts were made to
find some specific economic indicators that have been assessed in the
area: direct contact was established with the authorities of HIWWT who
manages the reserve. Detailed information about land uses, the number of
visitors, economic inputs and outputs, among others were obtained. The
search for economic values and indicators (land value, land rent cost
for agriculture or grazing land) were carried out. Details on certain
goods and services that were not open to the public and therefore could
not be properly surveyed during the field survey were identified. Those
cases in which no specific economic values were found, the methodology
allows the use of estimations from other studies that addressed the
economic contribution of similar EGS in more general terms, such as the
work of Morris and Camino (2011) and official document from UK’s
Environmental Agency, as well as the opportunity cost of the EGS under
consideration. It is also important to emphasize that in all cases where
EGS have a range of values, this project always assumed the lowest one
for the valuation to avoid potential overestimation.
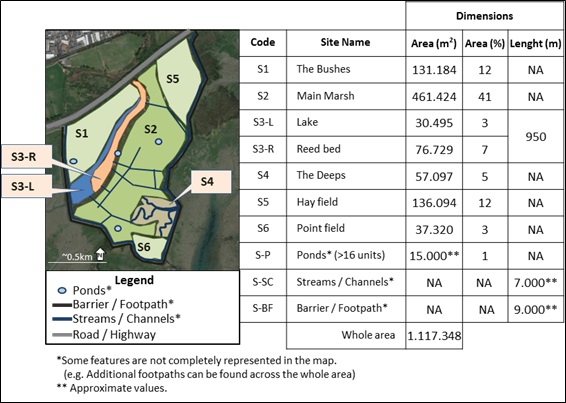
Figure 6. Map of the study area with the zonation of the different sites
4. RESULTS
The methodology was successfully applied to the case study area. The
performance of the tools could be explained by means of its time
efficiency, its versatility and its user-friendliness. In terms of the
time and effort used to conduct the full assessment, it is important to
point out that the time required to apply the methodology would be
subject to certain factors such as the dimension of the assessed site,
the design of the survey (number of sites to be addressed or ecosystem
features), the accessibility to the site and even the availability of
information. For this reason, this work will focus on the approximate
time that was applicable to the Farlington Marshes scenario, with an
area of 120 hectares and at least 9 specific sites or features to be
assessed. This methodology took around 60-85 man-hours to complete the
first phase of Ecosystem Characterisation, and 55-75 man-hours to
complete the second phase (Figure 3 and Table 3). These times are
referential estimations based on the actual times. Because of their
qualitative nature, details about the versatility and complexity will be
covered later in the discussion.
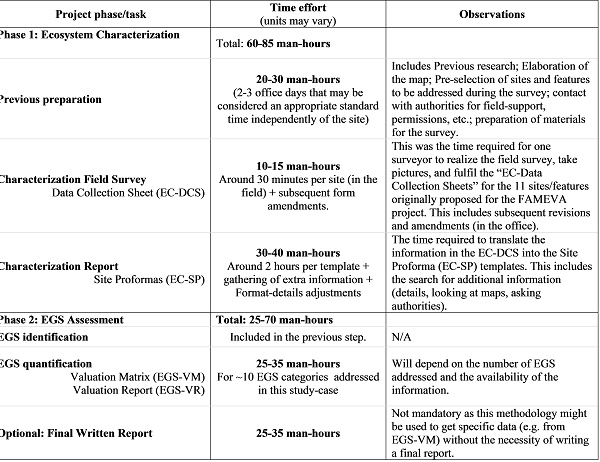
Table 3. Time-effort estimations for each phase during the FAMEVA
project.
The detailed assessment of each of the sampled sites or features were
processed into 9 site proformas to facilitate analysis of data gathered
from the field. However, these proformas have been summarised into one
general EC-Site Proforma (Figure 7) for the whole area just to reduce
the size of the paper. In addition, the general goods and services
characterisation results have been presented in Table 5.
Place Name: Farlington Marshes
Site Name: Farlington Marshes Site Code: NA
Location: Portsmouth, Hampshire, UK
Site Coordinates: 50°49'58.13" N 1°01'36.26" W
Area: 1,117,348 m2
Project: FAMEVA
Date of Survey: 16-June-2016; |
Map of the study area.
|
|
General Overview: This site is a coastal grazing marsh with lagoons,
meadows, ponds and pools (may be categorized as a Marine Intertidal
marsh (H) according to RAMSAR classification). It has a network of
streams and channels and comprises both fresh and brackish glasses of
water. The land was reclaimed from the sea in the 18th century and
currently, it is enclosed by a concrete barrier with a floodgate inlet
controlling the amount of seawater allowed into the main lagoon. As a
whole, this marsh appears to be in good condition (4/5). It possesses
various conservation designations as it provides feeding and roosting
sites for several bird species. For the purpose of this assessment the
area has been partitioned into 9 distinctive sections based on
different identifiable features: the bushes (S1), the main marsh (S2),
the lake with its Reedbed (S3-L. and S3-R), the ramified lagoon called
“The Deeps” (S4), the hay field (S5), the Point field (S6), the Ponds
and Pools in the whole area (S-PP), the Channels-Streams (S-CS), and the
Barrier-Footpaths (S-BF).
|
|
Ecosystem Characteristics
Geomorphology: It includes water bodies such as lagoons, pools/ponds,
streams-channels and reed beds; and terrestrial areas such as
prairie-like fields, hay fields, footpaths (grass, pebble-rocks, and
dirt), and dry areas of the marsh.
Processes: Seawater exchange is controlled by a floodgate inlet in the
lagoon, in the west side of the wall, and a network of channels and
streams connect this inlet with other water bodies in the whole area.
Nevertheless, the rain is also a major contributor to some of the water
bodies (e.g. the deeps, and some ponds) where the influence of the
seawater may be negligible. Other processes are addressed in the
other specific Site Proformas for each site location (not included in
this paper).
Biodiversity: In terms of Fauna, the most relevant feature is that it
supports different populations of birds (such as Brent Goose, Wigeon,
Shoveler, Pintail, Black-tailed Godwit, Marsh Harrier, Short-eared Owl,
Bearded Tit, Avocet, Dunlin, Grey Plover, Redshank, Curlew, Ringed
Plover, Turnstone, Oystercatcher, Black-necked Grebe, Great Crested
Grebe, Peregrine Falcon, Merlin, Sedge Warbler, Reed Warbler, Skylark,
Lapwing, among others), including migratory and non-migratory species.
Cattle can be found grazing in different areas of the marsh. Though it
was historically used for grazing, currently the cattle is there to
control the vegetation growth. In addition, many rabbits can be found in
the whole area. In terms of vegetation, many flowering plants are
present here, including unusual species such as sea barley and
Corky-fruited water dropwort. The Reedbed, most of it present in the
lagoon (S3), is also a major feature of this marsh.
|
|
Ecosystem Goods and Services: In terms of regulation-support, the most
relevant are those related to the maintenance of the life cycles and the
genetic biodiversity; also, the moderation of extreme events such as
floods and storms. In terms of supply and exploitation, the potential
use (or previous historic use) of the land for agriculture and
fodder-pasture are barely the most relevant as this is a protected site
and any extraction is prohibited. In terms of logistic-cultural
benefits, the aesthetic features and the infrastructure allows the use
of education and pedagogy, hiking and dog walking. See the table (next
page) summarizing the EGS addressed for each site.
|
|
Management Information: In relation to the uses of the land, it is open
to the public (for recreation, dog walking, bird-watching, etc.) with
access restriction in some areas. It is a reserve for sensitive species
and even the livestock are present not for agricultural purposes, but
they are used as a natural cost-effective way to control the growth of
vegetation. There are other management interventions by means of
infrastructure (fences, doors, house-office, sea-inlet, etc.),
signalling (site description and maps, biodiversity description, rules,
instructions and security warnings), care measures (staff working,
equipment, and evidence of recent maintenance), among others. Some
management issues that seem to require permanent or minor attention are:
care for the livestock, maintenance of the seawall for cleaning or major
amendments in case of extreme events, cleaning of litter or natural
waste (vegetation, faeces) in the footpaths and other inner areas,
maintenance of the floodgate inlet, surveillance and care measures to
protect the biodiversity. It is managed by HIWWT and it holds different
protection features or conservation designations, including SPA
(Chichester and Langstone Harbours), SAC (Solent and Isle of Wight
Lagoons), Ramsar (Chichester and Langstone Harbours), SSSI (Langstone
Harbour) and LNR (Farlington Marshes)
|
|
Other images:
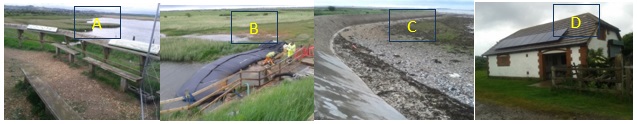
A)Panoramic view and signs in the Lake, B)Repairs of the inlet, C)Litter
on the external side of the barrier, D) The House
|
Figure 7 EC Site Proforma for Farlington Marshes
The final EGS assessment can be viewed in the EG-Valuation Matrix
(sample extract, Table 6) and the EGS-Valuation Report (Table 4). The
main outcome from the valuation report was that Farlington Marshes has a
total value of £7,754,495, which can be disaggregated into fixed value,
£6,180,682 (80%) and variable value £1,573,813 per year (20%). In the
same way, the total value can be disaggregated by the type of EGS and
the result is that Regulating-Support services are the most relevant
with a total contribution of £5,124,956, where Carbon sequestration,
protection against floods, protection against storms, natural
irrigation, water purification, coastal protection, formation of
habitats and services for migratory species are the main services; they
are followed by the Cultural-Logistic services that contribute around
£2,484,621 being landscape and aesthetic features, tourism and
touristic infrastructure, the value of the lands for human development,
education and pedagogy are the main categories; and finally, the minor
contributor was the group of Supply-Exploitation goods and services
where the main categories are agriculture and fodder-pasture with a
contribution of £144,917.
Detailed information can be extracted from the Valuation Matrix, where
the individual economic contribution of each EGS category and the
details about how the values were estimated are presented (because of
its size, in this paper we include only an extract of the full table).
The most relevant categories surpassing the £1 million limit are:
coastal protection with a fixed contribution of £2,800,000 based on the
replacement cost of constructing a gabion revetment at the shoreline
covered by the reserve; secondly, the value of the lands for human
development was estimated at £2,208,863 based on the average
purchase price of arable or pasture lands (£8,000 /acre) provided
by the RICS (2015); the last big contributing category was the services
that relate to the maintenance of life cycles (habitat formation,
nursery, services for migratory species, amongst others) that was valued
at £1,171,819. Details of the estimations are included in a large table
not suitable for this publication.
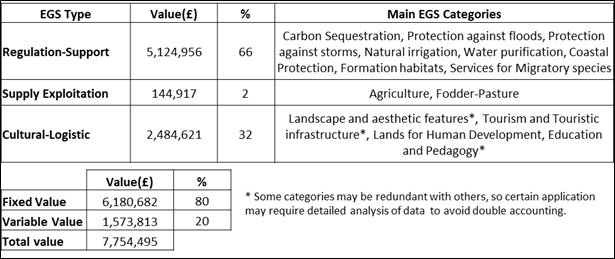
Table 4. Ecosystem Goods and Service Valuation Report (EGS-VR).
Note that this is an extract from the original spreadsheet, where more
information could be found (e.g. EGS classification levels, total costs
per unit area, etc.) depending on the interest of the user.
5. DISCUSSION
The AESVA is an adaptable and useful approach that can be applied to
conduct a full EGS valuation. The provision of the proposed templates
and spreadsheet makes it a time-saving the resource, it helps
practitioners to avoid spending lots of hours developing and designing
materials and tools. In terms of the time and effort, this methodology
allows professionals to conduct a full EGS assessment of a location like
Farlington Marshes within 85-120 man-hours (equivalent to 9 to 12 days
of exclusive dedication), to produce at least, actual valuation report
that provides the key economic indicators for decision making (Fisher et
al. 2009). Another important goal is to provide a tool to reduce
uncertainty related to some EGS assessment methods as described by
Hammel & Bryant (2017), by encouraging the use of more credible
indicators such as real market value or opportunity cost, with an
evidence-based approach in a simple and flexible framework that can be
easily adapted, exchanged and updated.
AESVA was developed to be used for multiple scenarios (e.g. different
kinds of habitats, information sources, or users), and this can be
appreciated in different ways, such as the integrative classification
scheme for the EGS allowing the navigation between the different
typologies, the simple layout of the ecosystem characterisation
templates (DCS and SP) could be useful for both scientific and
management applications, as well as the option to put the values of the
economic contribution per area using different units (square metres or
acres), amongst other examples. It was designed to be easy-to-use, so
minimal or no induction is required to be able to use it. Thus, users
can save time making calculations and designing the layout of the
tables. Further to these characteristics was the possibility to make
modifications to the proposed layout to fit their own requirements (e.g.
change total area that is going to be used to multiply the unitary
value, change the currency symbol, add more EGS categories and use their
own colour code among others).
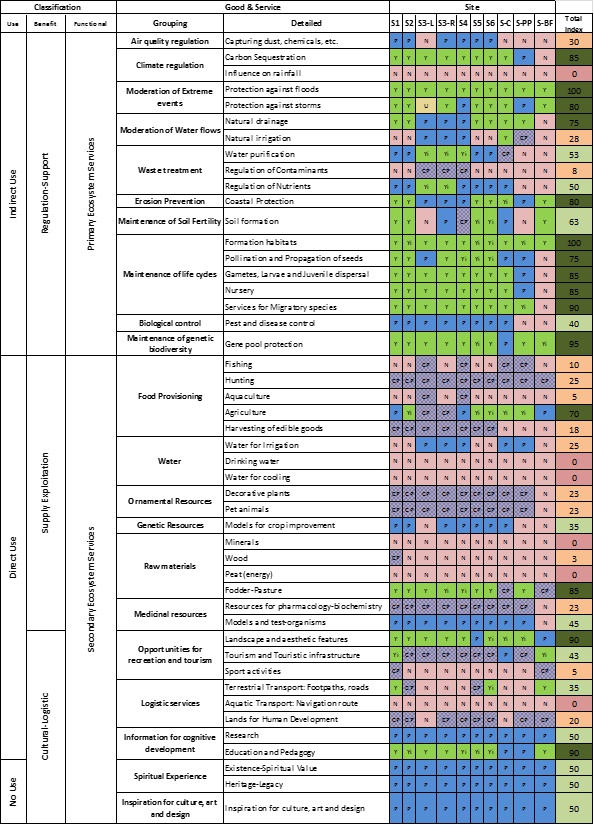

Table 5. Comprehensive classification management and diversity issues of
EGS of Farlington Marshes
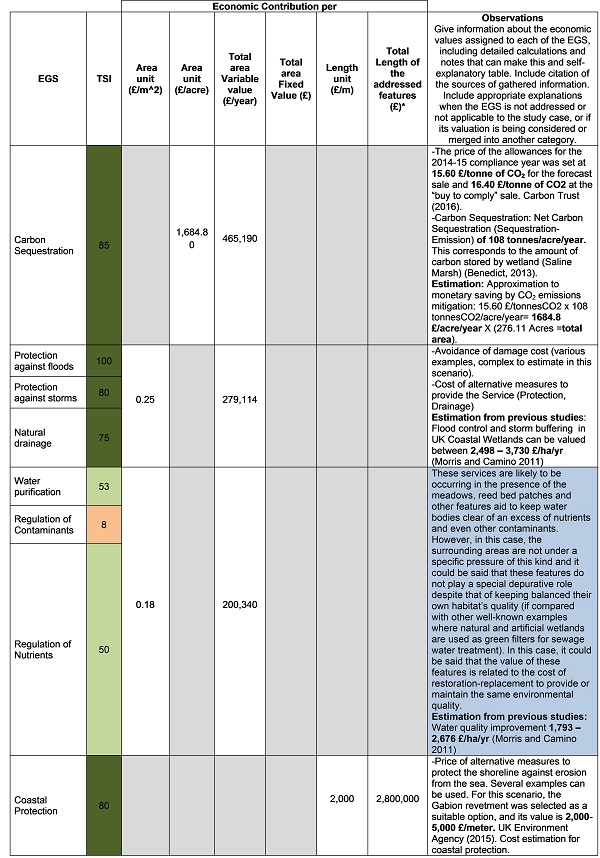
Table 6. Extract of EG-Valuation Matrix (EGS-VM) for the FAMEVA Project
Though some technical challenges came out in the course of this project,
however, they were all fixed effectively. For example, what to do when a
multiple-site assessment turns too reiterative or too complex; what to
do to save time when converting or unifying the units of the indicators;
what to do if the contribution of an EGS category is included or is
redundant with another one; among others. Most of these situations were
solved during the application of the approach to the case study area.
All the templates were reviewed to include solutions developed during
the case study. This paper suggests that more application of the
approach to wetlands with different characteristics should be considered
in order to make this methodology more adaptable and integral to the
economic valuation of ecosystem services. It would be useful to apply
this approach to a wetland which has been previously assessed with other
methodologies, just to evaluate if the findings using this rapid and
alternative assessment methodology matches those from the other
“revealed preference” methodologies that require higher efforts and
opinions of wetland users.
The application of the AESVA to Farlington Marshes and the
corresponding economic assessment of the EGS offered by the wetland has
a total estimated value of £7,754,495 comprising 80% fixed component and
20% for the variable value. Grouping the economic contribution in terms
of the type of benefits: the “Regulation-Support” category was 66% of
the contribution, while “Cultural-Logistic” functions followed with 32%,
and finally the “Supply-Exploitation” group just added 2% of the total
value. This results support the need for protection of Farlington
Marshes as a reserve. The marshes offer important valuable services in
terms of life cycle maintenance, services for migratory species, the
formation of habitat and some regulation functions (HIWWT n.d).
6. CONCLUSION
This paper has developed the AESVA as a versatile and easy to use the
resource to achieve a reliable valuation of EGS. The approach is
exceptional for its simplicity and the inclusion of innovative traits
such as the open-access resources that can be used as a ready-to-use
framework or modified to fit different purposes. The application of the
AESVA approach to Farlington Marshes was also successful for both
pre-established purposes: primarily, serving as a case study to run and
test the methodology in order to identify potential gaps and adjust it
to the actual demand of a real case scenario. The paper has also
contributed to the knowledge of the local nature reserve through the
assessment of the economic value of EGS Farlington Marshes.
7. ACKNOWLEDGEMENTS
This work could not be possible if it was not for the Funding of the
Murray Foundation and the University of Portsmouth.
8. REFERENCES
Ahmed, S. U., & Gotoh, K. (2006). Cost-benefit analysis of
environmental goods by
applying the contingent valuation method: Some Japanese case studies.
Tokyo: Springer.
Barbier EB, Acreman M, Knowler D (1997) Economic valuation of
wetlands: A guide for policymakers and planners. In: Ramsar Convention
Bureau. Gland, Switzerland, Barbier, E. B., Georgiou, I.Y., Enchelmeyer,
B., Reed, D.J. (2013). The Value of Wetlands in Protecting Southeast
Louisiana from Hurricane Storm Surges. Plos. One 8, pp.169–193. Doi:
10.1371/journal.pone.0058715Barbier, E.B., Hacker, S.D., Kennedy, C.,
Koch, E.W., Stier, A. C. & Silliman, B.R. (2011). The value of estuarine
and coastal ecosystem services. Ecological Monographs 81. Pp.169–193.
Doi: 10.1890/10-1510.1
Benedict, L. F. (2013). Wetland Soil Carbon Sequestration. Retrieved
from:
http://www.lsuagcenter.com/portals/communications/publications/agmag/archive/2013/spring/wetland-soil-carbon-sequestration
Bockstael, N., Costanza, R., Strand, I., Boynton, W., Bell, K. &
Wainger, L. (1995). Ecological economic modelling and valuation of
ecosystems. Ecological Economics 14. Pp.143–159. Doi:
10.1016/0921-8009(95)00026-6
Boyd, J. & Banzhaf, S. (2007). What are ecosystem services? The need
for standardized environmental accounting units. Ecological Economics,
63. Pp. 616-626. Doi:10.1016/j.ecolecon.2007.01.002
Brett, C., Pérez-Ruzafa, A., Marcos, C. (2015). Assessment of the
state of knowledge of the environmental goods and services associated
with coastal lagoons. Universidad de Murcia
Camacho-Valdez, V., Ruiz-Luna, A., Ghermandi, A. & Nunes, P. L. D.
(2013). Valuation of ecosystem services provided by coastal wetlands in
northwest Mexico. Ocean & Coastal Management 78, pp.1–11. Doi:
10.1016/j.ocecoaman.2013.02.017
Carbon Trust, (2016). CRC Energy Efficiency Scheme.
https://www.carbontrust.com/
resources/guides/carbon-footprinting-and-reporting/crc-carbon-reduction-commitment.
Christie, M., Hyde, T., Cooper, R., Fazey, I., Dennis, P., Warren,
J., Colombo, S. & Hanley, N. (2011). Economic Valuation of the Benefits
of Ecosystem Services delivered by the UK Biodiversity Action Plan
(Defra Project SFFSD 0702) Final Report.
Costanza, R. De Groot, R., Sutton, P., van der Ploeg, S. Anderson, J.
S., Kubiszewski, I., Farber, S., Turner, R.K. (2014). Changes in
the global value of ecosystem services. Global Environmental Change
Volume 26, May 2014, Pp. 152–158.
http://dx.Doi.org/10.1016/j.gloenvcha.2014.04.002
De Groot, R. S., Wilson, M. A., Boumans, R.M.J. (2002). A typology
for the classification, description and valuation of ecosystem
functions, goods and services. Ecological Economics, 41, pp. 393–408.
Doi: 10.1016/S0921-8009(02)00089-7
Defra, (2007). An introductory guide to valuing ecosystem services.
Forestry 68. Retrieved from:
http://ec.europa.eu/environment/nature/biodiversity/economics/pdf/valuing_
ecosystems.pdf
Esteves, L.S., Foord, J. & Draux, H. (2012). The shift from
hold-the-line to management retreat and implications to coastal change:
Farlington Marshes, a case of conflicts. EGU General Assembly 2012, held
22-27 April 2012 in Vienna, Austria, p11272 14:11272.
Fisher, B., Turner, R. K. & Morling, P. (2009). Defining and
classifying ecosystem services for decision making. Ecological
Economics, 68, pp643-653. Doi:10.1016/j.ecolecon.2008.09.014
Ghermandi, A., Van Den Bergh, J.C.J.M., Brander, L.M., de Groot,
H.L.F. & Nunes, P.A.L.D. (2010). Values of natural and human-made
wetlands: A meta-analysis. Water Resources Research 46. Pp.1–12. Doi:
10.1029/2010WR009071
Hammel, P. &. Bryant, B.P. (2017). Uncertainty assessment in
ecosystem services analyses: Seven challenges and practical responses.
Ecosystem Services, 24, 1-15 DOI:
https://Doi.org/10.1016/j.ecoser.2016.12.008
Hampshire & Isle of Wight Wildlife Trust Farlington Marshes.
Retrieved from:
http://www.hiwwt.org.uk/reserves/farlington-marshes.
Hein, L., van Koppen, K. De Groot, R. S. van Ierland, E. C.
(2006). Spatial scales, stakeholders and the valuation of ecosystem
services. Ecological Economics, 57, 209– 228.
Doi:10.1016/j.ecolecon.2005.04.005
Holland, T. G., Coomes, O. T. & Robinsona, B. E. (2016). Evolving
frontier land markets and the opportunity cost of sparing forests in
western Amazonia. Land Use Policy 58, PP. 456–471.
http://dx.Doi.org/10.1016/j.landusepol.2016.08.015
Hueting, R., Reijnders, L., De Boer, B., Lambooy, J. & Jansen, H.
(1998). The concept of environmental function and its valuation.
Ecological Economics 25. Pp, 31–35. Doi:10.1016/S0921-8009(98)00011-1
Imberman, S. A. and Lovenheim, M. (2013). Does the market value
value-added? Evidence from housing prices after a public release of
school and teacher value-added, CESifo Working Paper: Economics of
Education, No. 4105
Kalay, A. Karakaş, O. Pant, S. (2014). The Market Value of Corporate
Votes: Theory and Evidence from Option Prices. Journal of Finance,
Volume 69, Issue 3, Pp 1235–1271. DOI: 10.1111/jofi.12132
Kubiszewski, I., Costanza, R., Anderson, S. & Sutton, P. (2017). The
future value of ecosystem services: Global scenarios and national
implications. Ecosystem Services.
DOI:http://dx.Doi.org/10.1016/j.ecoser.2017.05.004
Landers, D.H. & Nahlik, A.M. (2013). Final ecosystem goods and services
classification system (FEGS-CS). 108. Retrieved from:
https://gispub4.epa.gov/FEGS/FEGS-CS%20FINAL%20V.2.8a.pdf
Ledoux, L. & Turner, R. K. (2002). Valuing ocean and coastal
resources: A review of practical examples and issues for further action.
Ocean and Coastal Management, 45, pp. 583–616. Doi:
10.1016/S0964-5691(02)00088-1
Liquete, C., Piroddi, C., Drakou, E.G., Gurney, L., Katsanevakis, S.,
Charef, A. & Egoh, B. (2013). Current Status and Future Prospects for
the Assessment of Marine and Coastal Ecosystem Services: A Systematic
Review. PLOS ONE. Doi: 10.1371/journal.pone.0067737
Morris, J. & Camino, M. (2011). Economic assessment of freshwater,
wetland and floodplain (FWF) Ecosystem Services. European Environment
78. Retrieved from:
http://uknea.unep-wcmc.org/LinkClick.aspx?fileticket=lVLEq%2BxAI%2BQ%3D&tabid
Perni, A. Martinez-Carrasco, F. & Martínez-Paz, J.M. (2011). Economic
valuation of coastal lagoon environmental restoration: Mar Menor (SE
Spain). Ciencias Marinas 37, pp.175–190.
Pert, P., Costanza, R., Bohnet, I., Butler, J., Kubiszewski, I.,
Sutton, P., Mulder, K., & Bohensky, E. (2012). The Ecosystem Service
Value of Coastal Wetlands for Cyclone Protection in Australia. Institute
for Sustainable Solutions Publications and Presentations. Paper 26.
Retrieved from:
http://pdxscholar.library.pdx.edu/iss_pub/26/
Potts, T., Burdon, D., Jackson, E.L., Atkins, J., Saunders, J.,
Hastings, E. & Langmead, O. (2014). Do marine protected areas deliver
flows of ecosystem services to support human welfare? Marine Policy 44.
Pp.139–148. Doi: 10.1016/j.marpol.2013.08.011
Ramsar Convention Secretariat, (2010). Designating Ramsar sites:
strategic framework and guidelines for the future development of the
List of Wetlands of International Importance,
Ramsar handbooks for the wise use of wetlands, 4th edition, Vol. 17.
Ramsar Convention Secretariat, Gland, Switzerland.
Ramsar Convention Secretariat, (2013). The Ramsar Convention Manual,
6th edition. The Ramsar Convention Manual: a guide to the Convention on
Wetlands (Ramsar, Iran, 1971) 109.
Remoundou, K., Koundouri, P., Kontogianni, A., Nunes P.A. L.D,
Skourtos, M. (2009). Valuation of natural marine ecosystems: an economic
perspective. Environmental Science and Policy 12. Pp.1040–1051. Doi:
10.1016/j.envsci.2009.06.006
RICS, (2015). Rural Land Market Survey H1 2015. RICS Economics.
Retrieved from:
http://www.rics.org/Global/RICS%20RAU%20Rural%20Land%20Market%20Survey%20H1%202015.pdf
Russi, D., ten Brink, P., Farmer, A., Badura, T., Coates, D.,
Förster, J., Kumar, R. & Davidson, N. (2013). The economics of
ecosystems and biodiversity for water and wetlands. IEEP, London and
Brussels; Ramsar Secretariat, Gland.
UK Environment Agency, (2015). Delivering benefit through evidence:
Cost estimation for coastal protection – summary of evidence Report.
Bristol: Environment Agency. SC080039/R7
UK Land and Farms, (n.d). South East Rural Property Price. Retrieved
from:
(http://www.uklandandfarms.co.uk/rural-property-for-sale/south-east/hampshire/kingsley-kqa5ma14/#)
The United States Environmental Protection Agency, (2012). CADDIS:
The Casual analysis/diagnosis decision information system. Retrieved
from: https://www3.epa.gov/caddis/. Accessed 1 Aug 2016
9. CONTACTS
Carlos Brett
The University of Portsmouth
PO2 7AS, 88 Sultan Road
Portsmouth, United Kingdom
Email: cajabrett[at]gmail.com,
Tel: +44-07932592184
Dr Isaac Boateng
The University of Portsmouth,
PO1 3AH, Portland Building, Portland Street,
Portsmouth, United Kingdom
Email: isaac.boateng[at]port.ac.uk
Tel: +44(0)2392842910
Fax: +44 (0)2392842913


