Using Crowdsourced Volunteered Geographic Information for Analyzing
Bicycle Road Networks
Jody Sultan, Gev Ben-Haim,
Jan-Henrik Haunert and Sagi Dalyot
1)
This paper was presented at the joint FIG Commission 3 & 7 Meeting "Crowdsourcing
of Land Information" in Malta,
16-20 November 2015. The paper focuses on road infrastructure and road
use; more specific on the interactions between traffic participants and
to help cyclists navigate safely in the urban environment. The paper
aims at exploiting available VGI data sources in the form of
crowdsourced base maps (OpenStreetMap) and GPS trajectories collected by
cyclists (GPSies).
SUMMARY
Under the umbrella of Green and Smart Cities, much is done nowadays
to provide cyclists with safe and sustainable road infrastructure. Since
cyclists frequently share the same space with pedestrians and motorized
vehicles, and since traffic loads continue to increase, understating the
current state of the network is required on regular basis to allow
future planning and modeling. Not all relevant information can be
gathered with the exiting authoritative infrastructures or through
surveys. A closer investigation of the road infrastructure and road use
at larger scale is required to study the usage, the interactions between
traffic participants and to help cyclists navigate safely in the urban
environment. The use of Volunteered Geographic Information has proven
its potential in road network analysis, mainly in respect to cars, thus
motivation exists to show its capacity for the task of bicycle road
network planning and modeling. This paper aims at exploiting available
VGI data sources in the form of crowdsourced base maps (OpenStreetMap)
and GPS trajectories collected by cyclists (GPSies). Spatio-temporal
analysis of different bicycle travel factors was implemented for the
cities of Amsterdam and Osnabrück using VGI only. This paper will
present this analysis, focusing on the data mining potential and
possibilities of using such data sources for extracting interesting
information that otherwise could not have been accomplished.
1. INTRODUCTION
Residents of urban environments are turning to bicycles as an optimal
alternative to move around cities, thus the number of citizens using
bicycles for commuting is markedly increasing. One can point to traffic
congestions, lack of parking space, improved cycleway infrastructure,
and healthy lifestyle as reasons that encourage this trend. Much is done
to provide pedestrians and cyclists with a safe and sustainable road
infrastructure, often under the umbrella of Green and Smart Cities.
Recent technological developments contribute to an overwhelming
transformation in the way that geographic data, information, and
knowledge are produced and disseminated. Volunteered geographic data
collected by citizens encapsulates the idea of using the Internet to
create, share, visualize, and analyze geographic information, envisioned
via the use of numerous computing devices and platforms. This citizen
science neogeography revolution has started to fundamentally transform
how geographic data are acquired, analyzed, and used. These types of
volunteered geographic data are available today via online platforms
mapping projects, e.g., OpenStreetMap (www.openstreetmap.org),
GPSies (www.gpsies.com).
Among others, this has recently led to the development of generating
maps of road networks from volunteered GPS trajectories. Though much is
done in relation to vehicle road network maps, not much work has been
done in this field in respect to other means of commuting, namely
cycling. Investigating navigation characteristics of cyclists is
possible when analyzing spatial patterns and travel behaviors. This can
lead to the assessment of current use and hence future planning and
modeling of road networks designed for bicycles.
Most travel surveys are handled with questionnaires or surveyors
positioned at main junctions. Since cycling is not as constrained to
roads as vehicular traffic, having many route alternatives and shared
roads, the above is impossible to handle, such that the required data
can be surveyed only by following the cyclists’ movements, i.e.,
inspecting and analyzing the users' activities. Such that personal
questionnaires are rarely effective here, since they are limited and
coarse – spatially as well as temporarily. This paper proposes a working
paradigm to mine cyclists' spatial patterns and behaviors via
crowdsourcing volunteered data in the form of contributed spatial
trajectories, which can be collected easily, straightforwardly,
accurately and comprehensively, actively by the cyclists themselves
using mobile devices.
For this, this research employs two existing volunteered geographic
datasets: GPSies (www.gpsies.com),
storing GPS trajectories collected by citizens, e.g., cyclists,
providing location and time data from smartphone sensors; and,
OpenStreetMap (www.openstreetmap.org),
serving as the road network infrastructure. The proposed methodology
uses data pre-processing on the GPS trajectories to filter data- noise
and -outliers, followed by vector-data alignment, which is aimed at
handling the matching and arrangement of the GPS trajectories with the
road network routes. Spatial data mining is employed to investigate and
identify specific interesting patterns of cycle routes, e.g., route
preferences, routing patterns and road-type use.
2. STATE OF THE ART
2.1 Volunteered Geographic Information (VGI) and
crowdsourcing
Volunteered Geographic Information (VGI) refers to the collaborative
accumulation of spatial data by individual users through a web platform
(Goodchild, 2007). Typically, individual users collect this data for
online mapping services or spatial-related websites, which assemble and
store the data in databases and display them on maps. Contributed
information, such as GPS, traces of cycling routes or trips through
places of interest, can be generated in a variety of ways and tools
(Castelein, 2010). The project OpenStreetMap (OSM), for example,
demonstrates the feasibility of individuals to create a massive
geographic data source – map of the world – that can be used for
multiple applications (Neis and Zielstra, 2014). It is common that even
commerce companies, such as TeleAtlas, NAVTEQ, and TomTom, ask their
users to help update their maps voluntarily (Coleman et al., 2009).
Though VGI often has a lower quality than authoritative data in terms of
completeness, thematic granularity, and homogeneity, it can be a rich
source of complementary information (e.g., Jackson et al., 2010; Sosko
and Dalyot, 2015). In particular, VGI can provide information on
vernacular places or local knowledge, which often is not represented in
maps, although heavily used by people in their daily lives. Several
researchers (e.g., Arampatzis et al., 2006; Newson and Krumm, 2009) have
investigated the automatic extraction of such information.
Though OSM offers a special map for cyclists (via the OpenCycleMap
website), it still lacks important attributes, e.g., for estimating a
bicycle level of service (Hochmair et al., 2015). Bicycle navigation
systems (e.g., Geowiki or Ride The City) are far from complete as
relevant data is missing and existing network maps and routes collected
by users are incompatible. To achieve a comprehensive picture,
information on personal experiences needs to be acquired. In the context
of cycling, Kessler (2011) investigated the degree to which VGI has been
assimilated by cycling groups using three web services designated for
cyclists. The author argues that despite the benefits of crowdsourced
VGI for this purpose, in most cases this information remains useless
online. Geospatial analysis of bicycle information can assist in
evaluating road-type use in terms of their potential to facilitate
bicycle activity. Such an analysis can be used to assess how certain
factors, such as infrastructure characteristics, affect choices of
cyclists (Hwang et al., 2013). Moreover, volunteered cyclist data can
help in processes related to transportation and commuting planning
(Smith, 2015).
2.2 Spatial trajectory handling
Large volumes of movement data have recently become available, as
positioning sensors have become small and cheap and users share their
trajectories online (i.e., sequences of positions with time stamps,
usually recorded with GPS, via OSM, for example). Analyzing trajectories
or, more generally, movement data has become a major research area in
spatio-temporal data mining (e.g., Andrienko and Andrienko, 2005; Laube,
2014). Trajectory-based approaches to understand route choices of
cyclist (Hudson et al., 2012) and pedestrians (Millonig and Schechtner,
2008) have been presented, yet mainly with a focus on the gathering of
data. Based on bicycle trajectories and repeated shortest path
computations in a given network representation, Hood et al. (2011)
succeeded in automatically estimating the parameters of a model for
bicycle navigation. Their model relies on the assumption that a route
that is optimal for a cyclist corresponds to a path of minimum total
weight in a graph, that is, the cost of a path is defined based on a sum
of edge weights. Furthermore, Hood et al. assume that the weight of each
edge results from a weighted sum of several attributes, e.g., length,
the number of turns, and slope. The aim was to define the coefficients
of the weighted sum (i.e., the attribute weights) such that the routes
resulting from shortest path computations and the actual routes of
cyclists recorded with GPS have a maximal overlap. Chen et al. (2011)
argue that the most popular route can be derived with statistical
analyses from routes historically generated by many other vehicles.
Given all existing routes between origin and destination, and the amount
of travel, the most popular route can be determined using popularity
functions. The assumption made is that a route extensively used is more
likely to be convenient, user friendly or popular. In the contexts of
cyclists, relying on route use is much more significant, since
convenience and safety play an important role in the choices of
cyclists.
2.3 Alignment and matching of vector data
One of the major problems of route-pattern mining (or trajectory
analysis) is spatial and geometric inconsistency of GPS tracks that can
be caused by GPS receiver inaccuracies, discontinuity or noise in the
data. Such problems can cause difficulties in map matching, which means
finding points and connecting paths in a road network model that
correspond to the vertexes and edges of a trajectory, respectively
(Brakatsoulas et al., 2005). Dalyot et al. (2012) presented a solution
to the problem of finding and resolving spatial inconsistencies in
different vector databases using a geometrical adjustment approach. In
the context of vehicles and road network, Cao et al. (2005) present a
solution for the matching problem. The authors used a heuristic approach
to detect frequent areas, using characteristics of patterns defined by
spatial areas around line segments. The geometric shape was translated
to a mathematical definition, i.e., defining road sections as line
segments with buffers around them. This representation allows GPS tracks
(point entities) to be spatially associated with corresponding roads
(line entities) despite inconsistencies and incompatibilities. Haunert
and Budig (2012) addressed the matching of GPS trajectories with a road
network in which roads are missing. The authors have extended the
map-matching algorithm introduced by Newson and Krumm (2009) that is
based on a hidden Markov model and a discrete set of candidate matches
for each point of the trajectory.
3. METHODOLOGY
3.1 Data and study area
The transportation network infrastructure (road network) for the two
case studies used as a base map is downloaded from the OSM database
(updated for June 15th 2015). OSM uses the “Highway” tag to represent
all roads, routes, ways, or thoroughfares on land, i.e., all roads/paths
used by motorized vehicles, cyclists, pedestrians, public
transportation, and others (excluding trains). The “Highway” tag
contains several sub-tags, where the ones used here are detailed in
Table 1. The “Cycleway” sub-tag is designated for cyclists only, and
mostly will exist as a segregated road on the map. However, lanes
allowed for cyclists are sometimes aggregated into a single road (and do
not appear separately), which is classified under an alternative sub-tag
category - "Primary". These roads can have separated cycle lanes, or one
shared road. In these cases, if inserted by OSM users, the sub-tag is
indicated by an additional tag "bicycle=yes". Still, this additional
information is often missing, though in some countries or areas it is
available, and hence possible to be extracted. Analyses stages are as
follows: first, a statistical analysis is performed according to the
main “Highway” tag (section 4.1.1), concerned with information to
whether designated cycling routes exist, derived from the default
settings of this category as given in OSM. Second, a more comprehensive
statistical analysis is performed, according to the “bicycle=yes” tag,
using all available sub-tag data (section 4.1.2).
Table 1. Tags used in OSM base map for roads describing where cycling
is allowed – and where not. "Unknown" refers to roads not defined in
OSM, i.e., it is unknown whether cycling is allowed – or not.
| Cycles Allowed |
Cycles Prohibited |
Unknown |
| Bridleway,
Cycleway, Footway, Living Street, Path, Residential, Service,
Tertiary, Tertiary Link, Track, Turning Cycle |
Construction,
Elevator Motorway, Motorway Link, Pedestrian, Primary, Primary
Link, Proposed, Road, Secondary, Secondary Link, Steps, Trunk,
Trunk Link |
Unclassified |
All road downloaded OSM segments and their attributed data are
converted to ESRI's shapefile file format (“.shp”). The two study areas
analyzed in this research are Amsterdam, The Netherlands, and Osnabrück,
Germany; both cities are known for their massive cycle use and
well-established and developed cycleway infrastructure. It is assumed
that these cycle-friendly cities can serve as good case study for the
paradigm presented here.
Usage data of cycling trajectories for both cities are downloaded
from GPSies, which is a relatively well-established online repository of
volunteered GPS trajectories free for download. “Cycling” and “Mountain
bike” trajectory types are used, supposedly representing routes used and
collected by cyclists only. All trajectories for both cities are
downloaded as “.gpx” file format, and converted into “.txt” file format
using the GPS Visualizer online convertor (www.gpsvisualizer.com).
The downloaded data are referenced to geographic WGS84 reference system,
presented using (φ, λ) position coordinates (latitude and longitude).
All data are then transformed into a local projected one to be used in a
local metric projection. The reference system used for Amsterdam is the
Dutch spatial reference system Amersfoort/RD New (EPSG or SRID (Spatial
Reference System Identifier) ID is 28992). For Osnabrück, the reference
system used is WGS84 UTM Zone 32N. OSM reference road infrastructure and
superimposed GPSies trajectories of both cities are depicted in Figures
1 and 2.
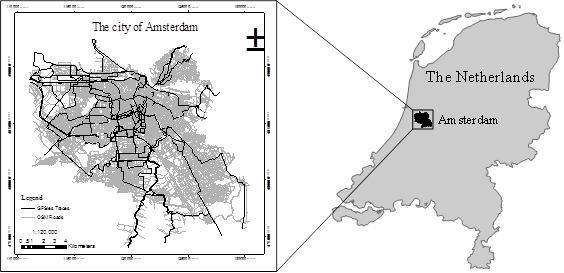
Figure 1. GPSies trajectories (in black) and OSM roads (in grey) for
Amsterdam.
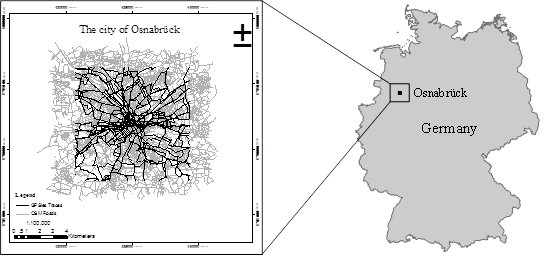
Figure 2. GPSies trajectories (in black) and OSM roads (in grey) for
Osnabrück.
3.2 Pre-processing of cycle trajectories
To ensure reliable data is processed, filtering of noise and outliers
is carried out on all GPS trajectories using a Matlab code. All
trajectories generated after this pre-processing stage are transformed
into polyline features for further processing.
3.2.1 Trajectory segmentation by distance
Due to the fact that not all GPS trajectories have a time stamp,
movement-related parameters are not always feasible to handle for
pre-processing task. Thus, the use of a distance parameter is used
between two consecutive positions in a single trajectory, assuming it
can be too long (far apart); in case it is long, most evidently both
locations do not represent correctly the used route. For this, the
Euclidian distance d between two consecutive trajectory points is
examined using a given threshold e. If the distance d between two
examined points i and i+1 is found to be larger than the threshold e,
the original trajectory is split into two segments, resulting in two
sub-trajectories. At the end of this process, each point is a part of a
single sub-trajectory, and is assigned its unique number. This procedure
ascertains that large clusters of points are separately segmented
according to the required resolution (determined by the threshold).
Figure 3 depicts the segmenting of a trajectory based on the distance
criterion e. In this study, the assumption is that data in the GPS
trajectory is collected with a time-resolution of 1 to 2 seconds, thus a
distance threshold value (e) of 20 meters is used (this value was later
ascertained by the map-matching algorithm). This value corresponds to
the commonly used maximum velocity value of cyclists in urban
environments, which is normally less than 10 meters per second (Zhang et
al., 2011).

Figure 3. Original trajectory segmented into
two new sub-trajectories, indexed 1 and 2, according to the distance
criterion e.
3.2.2 Sub-trajectory removal
Short trajectories, which might introduce noise and outliers to the
overall process, should be removed. Thus, the number corresponding to
the total number of points in the sub-trajectory is examined, using a
threshold for the required minimum number of points. In this study, this
threshold is set to 30 (points), which translates to a relatively short
trajectory of roughly 150 meters in length – a distance that is assumed
to resemble a single route taken by a cyclist, and is based on an
average velocity value of approximately 5 meters per second. In case a
trajectory segment contains fewer points than this value, the segment
(sub-trajectory) is removed. Figure 4 depicts a short trajectory - b –
that is removed from the database according this criterion. This
procedure verifies that considerably long and trajectories that are more
significant are kept, relating to the road network geometry and its
segments, while filtering trajectories that otherwise would have
introduced noise to the analysis.
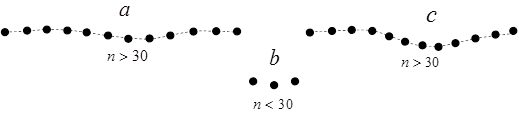
Figure 4. Sub-trajectories a and c are kept, while sub-trajectory b
is removed due to the small number of points (n=3).
3.3 Map Matching
Since GPS-data is accurate to 10 meters in position, it is obvious
that the trajectories are not positioned precisely on the roads. To
carry out the analysis, trajectories should be assigned to a road. To
solve the matching task, this study adopts the HMM-based map-matching
algorithm proposed by Haunert and Budig (2012), which proved to be a
reliable method for the problem of matching a GPS trajectory with a road
data set. We review the method in this section and discuss its
suitability for our purpose. This algorithm can be classified as an
offline map-matching global optimization algorithm, since it requires
the entire trajectory dataset as input, and also as a topological
map-matching algorithm, because it allows a user to constrain the output
path to the given network. However, because the algorithm allows some
GPS points to be left unmatched, it is relatively robust against missing
roads or, more generally, incomplete or outdated network models. This is
particularly important when matching trajectories of cyclists with a
general-purpose network model, i.e., a model not focusing on a
particular mode of transport. Furthermore, we think that it makes sense
to tailor the probabilistic model underlying the algorithm to a certain
mode of transport, for example, to define that candidates on a motorway
are very unlikely if the GPS trajectory was recorded by a pedestrian. In
the current implementation of the algorithm, however, the road type is
not taken into account. The algorithm decides whether the existing class
of a road edge should be kept or the class of a corresponding trajectory
edge should be assigned to that road edge. Figure 5 depicts two examples
for matching results of the algorithm.
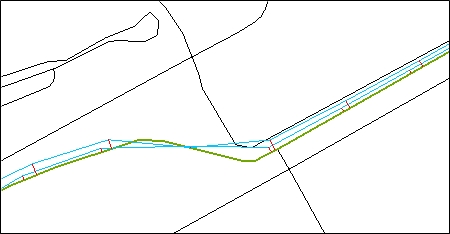
Figure 5. Two cycling traces (light blue) matched to the OSM base map
roads (black) and the final road match result (green). The algorithm
handles the matching of a single trajectory even when the trajectory is
deviated to an adjacent road, or when the trajectory does not go through
a junction.
3.4 Splitting polylines of OSM base map into
segments
Since matching works on segments level, OSM polylines are split at
intersections. This is done on input lines or polygon boundaries that
touch, cross, or overlap each other at locations; each of the split
lines become an output single line feature (segment). This procedure is
employed to ensure that each OSM road segment (polyline) is assigned
with the sub-trajectory value it is matched (aligned) to, even if the
entire sub-trajectory does not completely overlap it, as depicted in
Figure 6.

Figure 6. A single OSM road polyline (green line, ID=1) is split
according to intersections with the result of the map-matching algorithm
(red dashed polyline) into three segments (ID=11, 12, 13).
4. EXPERIMENTAL RESULTS
For the city of Amsterdam, roads with a total length of approximately
4,529.7 kilometers were obtained from OSM. For the city of Osnabrück,
roads with a total length of 3,140.2 kilometers were obtained. Data
obtained from GPSies are depicted in Table 2.
Table 2. Trajectories obtained from GPSies for the study areas.
| |
Number |
Total length [km] |
Average length [km] |
| Amsterdam |
412 |
802.4 |
1.9 |
| Osnabrück |
216 |
875.8 |
4.1 |
4.1 Highway-tag-based statistical use analysis
To investigate the space cyclists share with other commuters (e.g.,
pedestrians, drivers), the OSM base map roads were divided into three
categories based on the “highway” tag: roads cycling is allowed
(“allowed”); roads cycling is not allowed (“prohibited”); and
unclassified roads, which have missing definition regarding cycling
permission (“unclassified”) (see Table 1). Due to missing information
regarding the “unclassified” roads, this category was separately
analyzed to avoid biased results. Figures 7 and 8 depict the
classification according to these three categories in Amsterdam and
Osnabrück, respectively, after the implementation of the matching
algorithm.
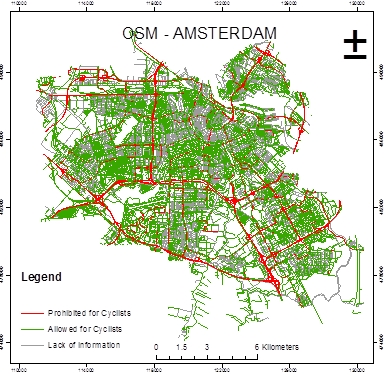
Figure 7. OSM base map of Amsterdam showing roads allowed for cycling
(in green) and prohibited (in red).
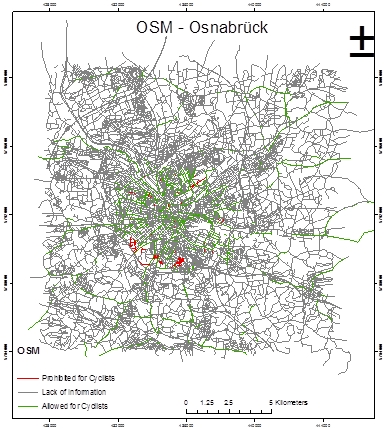
Figure 8. OSM base map of Osnabrück showing roads allowed for cycling
(in green) and prohibited (in red).
Tables 3 and 4 describe the road-type use of cyclists in Amsterdam
and Osnabrück, respectively, after the implementation of the matching
process. Again, types were classified into three categories: allowed for
cyclists; prohibited for cyclists; and unclassified (unknown). These
tables give a general picture of road-type use.
Table 3. Road-type use in Amsterdam according to general
classification: allowed (bold), prohibited and unclassified (grey
shaded). Usage values below 1% are not presented.
| Road type |
Total Road
Length [km] |
Usage [%] |
| Cycleway |
401.1 |
50.0 |
| Tertiary |
128.4 |
16.0 |
| Unclassified |
120.4 |
15.0 |
| Footway |
38.2 |
4.8 |
| Secondary |
35.8 |
4.5 |
| Residential |
24.6 |
3.1 |
| Primary |
21.9 |
2.7 |
| Service |
21.3 |
2.7 |
| Pedestrian |
9.0 |
1.1 |
Table 3 shows that the total bicycle usage percentage of designated
cycle roads in Amsterdam is 76.6%, whereas prohibited road usage is
8.5%; the latter is a relatively small number, but still one that should
be addressed by planners (translates to a total length of close to 70 km
of roads). The total cycle-use percentage of unclassified routes stands
at 15.0%. In general, it can be concluded that with the data analyzed,
cyclists prefer using cycle- designated and friendly roads.
Table 4. Road-type use in Osnabrück according to general
classification: allowed (bold), prohibited and unclassified
(underlined). Usage values below 1% are not presented.
| Road type |
Total Road
Length [km] |
Usage [%] |
| Residential |
323.1 |
36.9 |
| Tertiary |
116.0 |
13.2 |
| Unclassified |
79.8 |
9.1 |
| Secondary |
73.0 |
8.3 |
| Cycleway |
64.0 |
7.3 |
| Path |
49.7 |
5.7 |
| Primary |
38.6 |
4.4 |
| Footway |
35.6 |
4.1 |
| Pedestrian |
29.2 |
3.3 |
| Living Street |
23.7 |
2.7 |
| Track |
21.2 |
2.4 |
| Service |
21.0 |
2.4 |
Table 4 shows that the total bicycle usage percentage of designated
cycle roads in Osnabrück stands at 74.7%, very similar to the value in
Amsterdam, whereas prohibited road usage stands at 16.2% (double the
value in Amsterdam). The total-cycle use percentage of unclassified
roads stands at 9.1% (approximately 140 km). The highest rate in
Amsterdam (50.0%) is associated with cycleways, whereas in Osnabrück the
highest rate (36.9%) is associated with residential roads. Such
differences can be explained by the different infrastructure
development, urban planning policies or financial investment in cycle
routes.
Further analysis of the roads cyclists share with pedestrians and
vehicles was applied to investigate the potential risks of users. In the
shared roads of cyclists and pedestrians (i.e., Footway, Path, Living
Street and Pedestrian), the pedestrians are relatively more vulnerable.
On the other hand, when cyclists share roads with vehicles (e.g.,
Primary Road, Motorway), they are more exposed to physical injuries.
Table 5 shows the distribution of shared-roads usage between roads
allowed for cycling and roads which are prohibited. Numbers show that
the total percentage of shared roads is fairly high, mostly with
vehicular traffic, and mainly in Osnabrück, reaching more than 70%.
Another interesting element is that although majority of shared-roads
are designed to allow cyclists use – between 60-80%, still roughly more
than 20% of these roads are still used by cyclists although prohibited.
Table 5. The distribution of shared-road usage between roads allowed
and prohibited for cyclings in Osnabrück and Amsterdam.
| |
Osnabrück |
Amsterdam |
| Shared road
usage [%] |
Overall |
Overall |
|
Allowed |
Prohibited |
Allowed |
Prohibited |
|
Cyclists-Pedestrians |
15.8 |
6.0 |
| 61.7 |
38.3 |
80.4 |
19.6 |
|
Cyclists-Vehicles |
73.7 |
31.1 |
| 78.2 |
21.8 |
72.3 |
27.7 |
When considering the OSM base map, the results show that a relatively
large number of roads is tagged as unclassified. In Amsterdam this rate
stands at 12.7% and in Osnabrück at 8.0%. It is unclear to which type of
travel mode such roads are designed for, and whether cyclists are
allowed to use these roads. In fact, in several cases, an analysis
showed that cyclists, pedestrians and vehicles simultaneously use
unclassified roads. Figure 9 shows unclassified roads in Amsterdam, in
which cyclists and vehicles share the same space. For this reason, the
unclassified roads were not taken into account in the analysis.
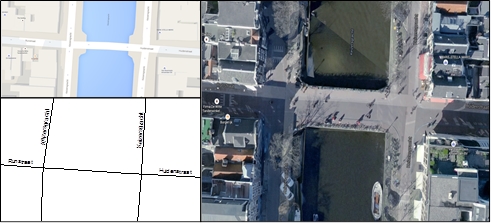
Figure 9. Unclassified-type Amsterdam streets Keizersgracht,
Runstraat and Huidenstraat, showing evidence of bicycle activity: Google
maps (top-left), OSM (bottom-left), Google maps imagery (right).
4.2 Sub-tag-based statistical use analysis
Abovementioned in Table 1, another classification was applied in
Osnabrück to further investigate the urban space cyclists share. This
time, OSM base map roads were divided into four categories: roads
designated for cyclists only (“Cyclists”); roads cyclists share with
pedestrians (“Cyclists-Pedestrians”); roads cyclists share with
motorized vehicles (“Cyclists-Motorized”); roads cyclists are not
allowed to use (“Prohibited”). This analysis was applied using the
classification of “bicycle=yes” tag indicating where bicycles are
permitted. This data was available for only 45% of the roads; in the
other 55%, data was missing. Still, the feasibility of the method in
detecting and classifying the space cyclists share with other modes of
travel is proven. The results in Table 6 clearly show that in Osnabrück
cyclists commonly use road infrastructure specifically designed
specifically for them (43.4% of the usage). Nonetheless, cyclists still
use shared infrastructure to commute (56.4%), thus making themselves
vulnerable in case shared with vehicles (26.1%), or putting pedestrians
under risk (30.3%). An interesting fact is that cyclists only rarely use
prohibited roads (0.2%), which is a very important information, proving
the maturity and availability of the existing road infrastructure.
Table 6. Road-type use in Osnabrück according to classification:
designated cycleways, roads cyclists share with pedestrians; roads
cyclists share with motorized vehicles; and roads cyclists are not
allowed to use.
| |
Category |
Usage [%] |
|
| |
Cyclists |
43.4 |
|
| |
Cyclists-Pedestrians |
30.3 |
|
| |
Cyclists-Motorized |
26.1 |
|
| |
Prohibited |
0.2 |
|
One point should be mentioned, related to the issue of data-
incompleteness and errors, which might stem from an incorrect
classification (derived from ill-defined or erroneous matching, or
ambiguous pre-processing), lack or wrong data contributed by users or
update problems. On the other hand, results still prove that such a
methodology can assist in decision making for future planning, due to
the fact that volumes of data do exist since many cyclists use these
routes. This information is accessible, free to use and can be used in
many applications and planning, proving yet again the potential
contributed geographic data holds
5. DISCUSSION AND CONCLUSIONS
This paper is focused on exploiting crowdsourced VGI, namely GPS
trajectories collected by cyclists, as well as road infrastructure
collected by citizens, to extract semantic information and to analyze
road-type use. The proposed analysis was applied using data of the
cities of Amsterdam and Osnabrück, proving its feasibility and
reliability even when certain data are missing or ambiguous. The
road-type-use analysis included a classification phase, in which the
road usage was classified into categories to investigate the space
cyclists share with other road users. Results showed that most cyclists
are using designated infrastructure (i.e., cycleways). However, a
significant part of the usage is associated with other road types,
designed for other modes of travel (namely, pedestrians and motorized
vehicles), with rare use of prohibited roads for cyclists – though still
exists. Despite the problem of data incompleteness, we conjecture that
road-type use of cyclists' behavior can be successfully and reliably
determined by the use of the proposed methodology. Patterns of
spatio-temporal behavior and road-type-use classification need to be
further investigated. The detection of preferences against certain road
segments is suggested by analyzing the routes taken by cyclists. This
can be achieved by spatial analysis (travel behavior and pattern
recognition) of the different road segments. Hence, the plan to derive
the characteristics and patterns of bicycle traffic depending on
location and time to extract "road-usage" characteristics of the
network. For example, if a road segment is infrequently used, one may
conclude that the road segment is systematically avoided by cyclists or
prohibited for them. This conclusion would be more justified, however,
if it is found that cyclists make detours bypassing a segment. Reasons
for such behavior should be also analyzed in respect to places and areas
of interest, and the way people perceive them. It is believed that such
an analysis can be made with the use of volunteered geographic
information.
REFERENCES
1. Andrienko, N., & Andrienko, G., 2006.
Exploratory Analysis of Spatial and Temporal Data: A Systematic
Approach. Springer Science & Business Media.
2. Arampatzis, A., van Kreveld, M.,
Reinbacher, I., Jones, C. B., Vaid, S., Clough, P., Joho, H., &
Sanderson, M., 2006. Web-Based Delineation of Imprecise Regions.
Computers, Environment and Urban Systems, 30(4), pp. 436–459.
3. Brakatsoulas, S., Pfoser, D., Salas, R., &
Wenk, C., 2005. On Map-Matching Vehicle Tracking Data. In Proceedings of
the 31st international conference on very large databases, pp. 853–864.
4. Cao, H., Mamoulis, N., & Cheung, D. W.,
2005. Mining Frequent Spatio-Temporal Sequential Patterns. In
proceedings of the Fifth International Conference on Data Mining (ICDM
‘05), pp. 82–89.
5. Castelein, W., Grus, L., Crompvoets, J.,
Bregt, A., 2010. A Characterization of Volunteered Geographic
Information. In proceedings of the 13th AGILE International Conference
on Geographic Information Science.
6. Chen, Z., Shen, H. T., & Zhou, X., 2011.
Discovering Popular Routes from Trajectories. In proceedings of the 27th
International Conference on Data Engineering (ICDE), pp. 900–911.
7. Coleman, D. J., Georgiadou, Y., & Labonte,
J., 2009. Volunteered Geographic Information: The Nature and Motivation
of Produsers. International Journal of Spatial Data Infrastructures
Research, 4(1), pp. 332–358.
8. Dalyot, S., Dahinden, T., Schulze, M. J.,
Boljen, J., & Sester, M., 2012. Geometrical Adjustment towards the
Alignment of Vector Databases. ISPRS annals of photogrammetry, remote
sensing and spatial information sciences, 4, pp. 13–18.
9. Goodchild, M. F., 2007. Citizens as
Sensors: The World of Volunteered Geography. GeoJournal, 69(4), pp.
211–221.
10. Haunert, J. H., & Budig, B., 2012. An Algorithm for Map Matching
Given Incomplete Road Data. In Proceedings of the 20th International
Conference on Advances in Geographic Information Systems, pp. 510–513.
11. Hochmair, H. H., Zielstra, D., & Neis, P., 2015. Assessing the
Completeness of Bicycle Trail and Lane Features in OpenStreetMap for the
United States. Transactions in GIS, 19(1), pp. 63–81.
12. Hood, J., Sall, E., & Charlton, B., 2011. A GPS-based Bicycle
Route Choice Model for San Francisco, California. Transportation
letters, 3(1), pp. 63–75.
13. Hudson, J. G., Duthie, J. C., Rathod, Y. K., Larsen, K. A., &
Meyer, J. L., 2012. Using Smartphones to Collect Bicycle Travel Data in
Texas (No. UTCM 11-35-69).
14. Hwang, H. L., Reuscher, T., Wilson, D. W., & Murakami, E., 2013.
Characterizing Walk Trips in communities by Using Data from 2009
National Household Travel Survey, American Community Survey, and Other
Sources. Oak Ridge National Laboratory (ORNL).
15. Jackson, M. J., Rahemtulla, H., & Morley, J., 2010. The
Synergistic Use of Authenticated and Crowd-Sourced Data for Emergency
Response. In proceedings of the 2nd International Workshop on Validation
of Geo-Information Products for Crisis Management (VALgEO), pp. 91–99.
16. Kessler, F., 2011. Volunteered geographic information: A
bicycling Enthusiast Perspective. Cartography and Geographic Information
Science, 38(3), pp. 258–268.
17. Laube, P., 2014. Computational Movement Analysis. Springer Briefs
in Computer Science, Springer-Verlag, Berlin, Germany.
18. Millonig, A., & Schechtner, K., 2008. Mobile Pedestrian
Navigation Systems – Wayfinding based on Localisation Technologies.
Research in Urbanism Series, 1(1), pp. 47–61.
19. Neis, P., & Zielstra, D., 2014. Recent Developments and Future
Trends in Volunteered Geographic Information Research: The Case of
OpenStreetMap. Future Internet, 6(1), pp. 76–106.
20. Newson, P., & Krumm, J., 2009. Hidden Markov Map Matching Through
Noise and Sparseness. In Proceedings of the 17th ACM SIGSPATIAL
international conference on advances in geographic information systems,
pp. 336–343.
21. Sosko, S., & Dalyot, S., 2015. Towards the Use of Crowdsourced
Volunteered Meteorological Data for Forest Fire Monitoring. In
proceedings of GEOProcessing '15, pp. 127–132.
22. Smith, A., 2015. Crowdsourcing Pedestrian and Cyclist Activity
Data. Pedestrian and Bicycle Information Center, Chapel Hill, North
Carolina.
23. Zhang, L., Dalyot, S., Eggert, D., & Sester, M., 2011.
Multi-Stage Approach to Travel-Mode Segmentation and Classification of
GPS Traces. In proceedings of the ISPRS Workshop on Geospatial Data
Infrastructure: from data acquisition and updating to smarter services,
4, pp. 13–18.
|