Article of the Month - April 2020
|
Comprehensive Databases for Seabed Environment
Kari Strande, Norway
This article in .pdf-format
(13 pages)
This paper was presented at the FIG Working Week 2019
in Hanoi, Vietnam. The article unique collaboration programme in Norway
called MAREANO. The programme contribute to a knowledge based
conservation and use of the resources at sea
SUMMARY
Sustainable management of the ocean and value creation linked to the
sea will play a vital role for the world's ability to realize the
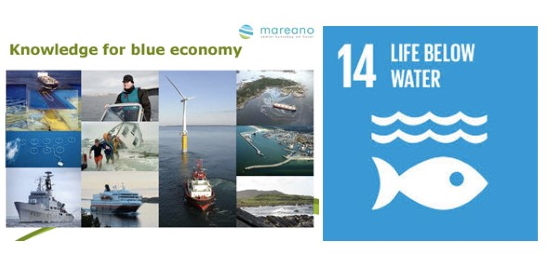
totality of the Sustainable Development Goals (SDGs) by 2030. The SDG
specifically addressing the ocean, SDG 14, stresses the urgent need to
“conserve and sustainably use the ocean, seas and marine resources for
sustainable development”.
Norway has a vast marine territory and harvests great wealth from the
sea. The fishing industry has been the heart of the Norwegian economy
for centuries, and revenue from the oil and gas industry now contributes
immensely. Despite this dependency on the sea, our knowledge of the
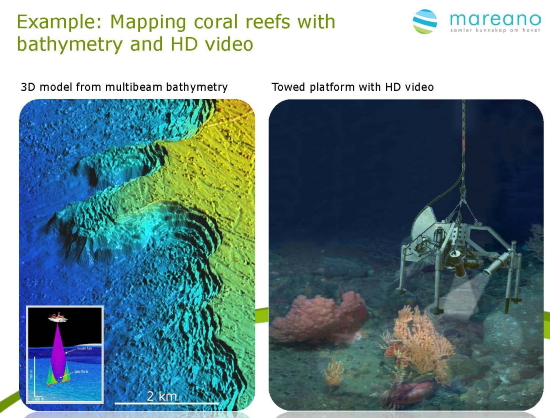
seabed environment has remained poor. Discoveries over the last decade,
such as the presence of numerous large coral reefs on the continental
shelf off central Norway, highlight how much remain unknown. The
Government has set out to fill the gaps in our knowledge through the
seabed-mapping programme MAREANO. (Marine areal database for Norwegian
Sea areas)
In this presentation, I will share the experiences from a
unique collaboration programme in Norway called MAREANO. The programme
contribute to a knowledge based conservation and use of the resources at
sea. The programme has also been presented for the World Bank, FAO and
the UN.
1. MAREANO – NEW KNOWLEDGE ON NORWAY'S MARINE AREAS
The MAREANO program developed through a collaboration between the
Institute of Marine Research (IMS), the Geological Survey of Norway
(NGU) and the Norwegian Mapping Authority Hydrographic Service (NHS). In
June 2005, five million kroner were granted for the start-up phase. At
last, after a seven-year-long effort, scientists and engineers could
finally start the mapping of bathymetry, geology and biology of the
seabed in the areas off Lofoten and in the southern Barents Sea.
There
are many arguments for this large-scale mapping of the marine
environment and marine resources. This is stated in Report No 12 to the
Norwegian Parliament (2001 – 2002) "Protecting the Riches of the Seas"
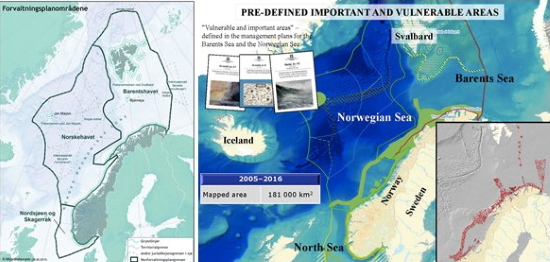
as well as in international conventions signed by Norway. The ecosystem
approach is incorporated in both the Marine Resources Act (2008) and the
Nature Diversity Act (2009). The Management Plans for the Barents Sea
and the Sea Areas off the Lofoten Islands follow up these principles, as
well as in the Management Plans for the Norwegian Sea and for the North
Sea and Skagerrak. All the management plans identify particularly
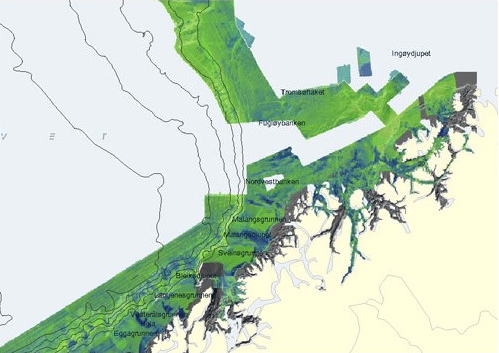
valuable and vulnerable area. Figure shows map of the Management Plans
area.
Sustainable use of coastal and marine resources must be
based on knowledge. However, this knowledge is difficult to obtain for
the various stakeholders within the public administration of
aquaculture, fisheries, oil and energy industry etc. Without substantial
effort to address this lack of knowledge, future decisions may be based
upon deficient foundations – hence the need for a large-scale national
initiative to map our sea areas.
Incomplete or missing knowledge of
the physical environment undermines the prospect of an integrated
management of resources and the environment. Historically, Norway has
made little effort to obtain basic knowledge of our seascape, a
knowledge that we take for granted on land; what does it look like? What
does the seabed consist of? Where are the coral reefs? What do we know
about natural diversity and about the interaction between seabed
geology, seascape, biodiversity and biological resources? Where do the
pollutants end up? We had only vague answers to these questions because
Norwegian coastal and sea areas were among the most poorly mapped in
Europe.
During the period 2006 -2018, the funding of the MAREANO has
increased from NOK 23,6 million to over NOK 100 million per year, the
focus still being to improve the knowledge as for future updates of our
respective Management Plans. Today Norway has Management Plans for all
its sea areas.
The Mareano programme has a Steering Group that
comprises representatives from five ministries. A program group,
responsible for the progress of the project, consists of government
representatives with management responsibilities for the sea areas as
well as management representative from the partner agencies. The
executive group consisting of The Norwegian Mapping Authority
Hydrographic Service (NHS), The Geological Survey of Norway (NGU) and
the Institute of Marine research (IMR) carries out the map production.
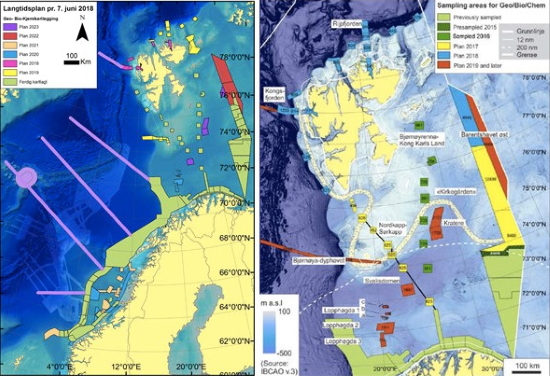
There is a long-term plan for the programme now updated on to 2023. The
left map below shows the planned area to be mapped and the area already
mapped. The annual plans are based on the long-term plan. However, there
can be some changes due to weather conditions, surveying capacity and
changed political priorities. The right map shops sampling areas for
Geo/Bio/Chemical samples.
2. SURVEYING THE OCEAN – HOW WE STUDY THE SEABED
The MAREANO program gives
information on bottom types, nature types, biotopes and geological
conditions. There are many deliverables from the programme that can be
examined at the MAREANO website http://www.mareano.no/en. Most
information is in Norwegian; however, some information is also presented
in English
Norway's sea area is as large as seven times the land area.
The sea floor is large and relatively unexplored. What is the most
efficient way of studying it? Although the sea floor in Norwegian waters
has been the subject of a number of geological and biological surveys,
they are not directly applicable to MAREANO. The most useful source of
information for the MAREANO project is the new full-coverage bathymetric
maps being produced in the first phase of the project. These maps, which
have a resolution of 5x5 metres, will play a key role in helping us to
carry out future research as efficiently as possible. They allow us to
recognise small structures on the sea floor such as coral reefs,
pockmarks and iceberg plough marks (which were produced when the ice cap
retreated around 10,000 years ago). However, it is hard to spot wrecks
and other objects or structures that are shorter than 20 metres long.
2.1 Basic bathymetric mapping
The National Mapping Authority
Hydrographic Service (NHS) delivers detailed bathymetric maps based on
measurements with multi-beam echo sounders. If bathymetric data of
adequate quality and resolution already exist, these will be used in the
MAREANO programme. Sources of existing data are NHS, the Norwegian
Defence Research Establishment (FFI), the Norwegian Petroleum
Directorate, the petroleum industry, universities, research institutes
and other bodies. New bathymetric mapping under the auspices of MAREANO
has mainly taken place in the Barents Sea and marine areas off the coast
off Lofoten (see the summary map below). The last year's bathymetric
mapping is carried out also at some part of the cost off Spitsbergen.
The seabed surveying is conducted using multi-beam echo sounders aboard
surface vessels, as shown in the illustration
below.
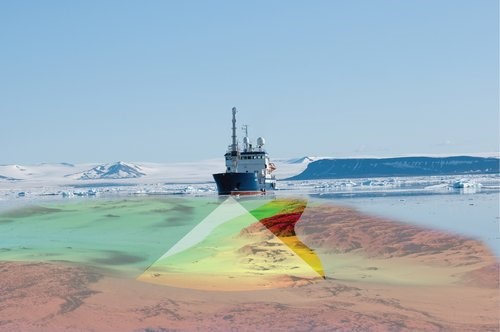
Bathymetric surveying using multibeam echosounder. The width of
the surveyed belt is approximately 3.5 times the sea depth.
Illustration: Norwegian Mapping Authority Hydrographic Service
2.1.1
Echo sounder
Since 2006, all bathymetric surveys at water depths of less
than 1200 metres are carried out using the EM710 echo sounder
manufactured by Kongsberg Maritime. This provides a dot spacing of
approximately 0.9 metres at a water depth of 100 metres, 1.8 metres at
200 metres depth, and so on. This makes it possible to create high
resolution (5 metre grid) terrain models which can be used to interpret
highly detailed seabed features (coral reefs, ripple marks, etc.). In
areas with more than 1000 metres water depth, the EM300 echo sounder is
mainly used, and provides coarser resolution. Echo sounders are normally
set up to measure 60 degrees on either side of the vertical, so that a
boat line covers a belt on the seabed that is 3.5 times as wide as the
water depth. In other words, if the water depth is 100 metres, a
350-metre wide belt is covered, in 200 metres of water the belt is 700
metres wide, and so on.
2.1.2 Additional measurements.
Measurements
from the echo sounders also provide reflectivity (backscatter) data that
contribute information about the nature of the seabed (hard or soft).
This provides a basis for interpretations of, among other things,
sediment distribution and habitat type. Since 2010, water column data
have also been acquired using echo sounders. These are reflections of
the sonic pulse as it travels through the water, before it reaches the
seabed. Such data can be used to detect gas bubbles in the water column,
for example.
In addition to echo sounders, instruments are needed to
measure the vessel’s position, motion (course, speed, heave, roll and
pitch) and the velocity of sound in the water, both close to the sonar
transducer and thorough the water column. The interaction between the
various sensors is important, and the installation of the equipment must
be accurately calibrated with reference to the vessel’s coordinate
system.
To obtain the best possible geographical positioning,
correction data are downloaded from GPS satellites following the actual
fieldwork, and these are used to refine the positioning data. The
recorded bathymetric data shall be filtered to remove noise and checked
for gaps. This involves a certain amount of manual work and is therefore
a time-consuming process.
2.1.3 Administrative and distribution
responsibility
The role of the Norwegian Mapping Authority Hydrographic
Service as a national administrator of bathymetric data places
considerable demands on quality assurance and the establishment of
bathymetric data in practical, modern administration and distribution
systems.
The completed data sets are used to produce data grids of 5,
25, and 50-metre resolution. Inside the territorial boundary, the
resolution is limited to 50 m in compliance with Norwegian military
classification regulations. The terrain models are available and can be
ordered for a charge by contacting the Norwegian Mapping Authority’s
distribution service by e-mail.
A WMS map service with shadow relief images has been created to
visualise detailed bathymetric conditions of seabed features (see the
illustration below). Map services have also been created which include a
summary of general bathymetric conditions in Norwegian waters, as well
as access to available bathymetric data administered by the Norwegian
Mapping Authority Hydrographic Service. Most WMS services are open and
can therefore be freely used in other applications and GIS tools.
See the overview of the Norwegian Mapping
Authority's open display services at geonorge.no.
All products and
services are available for download and use through the “Norway Digital”
initiative, in accordance with MAREANO’s data policy. Access to the map
services is also available by way of mareano.no and
geonorge.no.
2.2
Landscape, bottom types, sediments and geomorphology
The Geological
Survey of Norway delivers maps describing the bottom type, sediments and
geomorphology of the seabed based on terrain analyses of multi-beam echo
sounder, bathymetric data, video footage and sediment samples from the
seabed
2.2.1 Hard and soft bottoms
Just like the land surface, the
seabed varies in character, and ranges from bare rock and boulders to
soft clay.
Bottom reflectivity varies from low (blue, relatively soft,
fine-grained sediments) to high (green, relatively coarse and/or hard
sediments), and are depicted as a semi-transparent layer above a shaded
relief map.
The map of hard and soft bottoms is based on data acquired
using a multi-beam echo sounder. This instrument is used for detailed
mapping of water depths (bathymetry), but also supplies information on
the composition of the seabed through the strength of the audio signals
reflected back from the seabed. When the bottom reflectivity data are
processed, it is possible to acquire detailed information on variations
in the types of seabed.
The bottom reflectivity depends upon several
factors. A hard or coarse grained, stony type of seabed usually gives a
strong signal whereas fine-grained sediments on the bed give weaker
signals because the audio signals are absorbed. Other factors
influencing the bottom reflectivity are how well the sediments are
sorted and how even the seabed is.
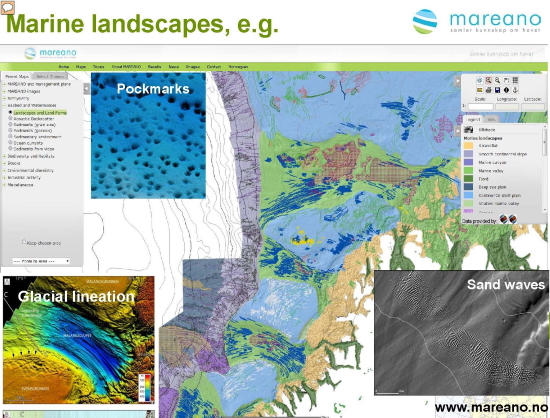
2.2.2 Marine landforms
The age of the
marine landforms can vary from just a few years to several million
years. Similarly, the size of the landforms can vary immensely. On the
continental slope, we find the giant submarine landslides that date
anywhere between a few thousand years to several hundred thousand years
old. Examples of seabed landforms mapped by MAREANO are channels,
canyons, sediment waves, areas with sediment waves, glacial lineation,
iceberg plough marks, moraines, slide escarpments, slide scars, slide
areas, areas with slide deposits, submarine fans and areas with
pockmarks.
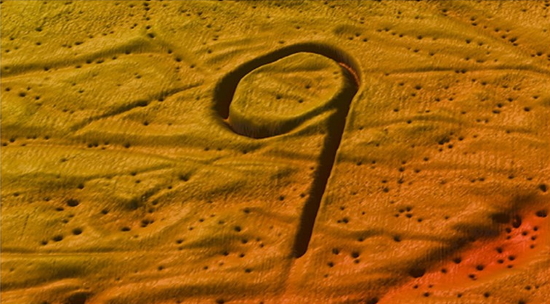
Ploughmarks from drifting icebergs that scraped
along the bottom in the Barents Sea. The "9" is about 1000 m long and
5-6 m deep that was formed at the end of the last ice age 10000 – 15000
yeras ago.
Locating these landforms is important for activities
related to construction on the sea bottom, fisheries, aquaculture, oil
and gas exploration, and environmental monitoring. Detailed mapping of
marine landforms is an important task for MAREANO.
2.2.3 Marine
landscape
MAREANO maps the large-scale marine landscapes of the seabed.
Landscape is here defined as "large geographical areas with a visually
homogeneous character”. The landscape classification in the sea areas
that have been mapped must be full-coverage and non-overlapping. That
means that every point must be classified as belonging to a single
landscape. MAREANOs mapping has so far covered 10 types of landscapes.
Bathymetric data enable to determine which areas should be classified as
plains, continental slopes, valleys and strand flats. The programme use
a GIS-based method that employs low-resolution depth data and parameters
that can be extracted directly from these to define the boundaries of
these features in a manner that is reproducible and as far as possible
does not involve interpretation. Examples of mapped landscapes:
- Strandflat. The crystalline platform that characterises large parts of
the Norwegian coast and contrasts sharply with the sedimentary
continental shelf in the way it is built up and its topography.
- Continental slope. The transition zone between the continental shelf and
the deep ocean. Large and small submarine canyons in several places
transect it.
- Marine valleys. Eroded into the continental shelf and the
strandflat, and a result of concentrated glacial erosion during the ice
ages.
- Fjords. Over-deepened erosion forms which cut into the land and
terminate at a threshold.
- Abyssal plain. Starts at the foot of the
continental slope and embraces all deep-sea areas with low relief,
including the continental rise.
- Continental shelf plain. The residual
landscape on the continental shelf, where the relief is predominantly
low, but there are nevertheless areas that are morphologically similar
to other types of landscape (particularly shallow marine valleys).
- Marine mountain landscape. Seabed area with high relief but without
clear valley shape. In Norwegian areas, this landscape type is mainly
found along the mid ocean ridges.
2.4
Mapping biotopes
Biotopes are a key concept in the MAREANO project. A
biotope is a combination of species and the physical environment in
which they live – a recognisable combination. This definition is close
to the definition of the term “nature type”, which is used by The
Norwegian Biodiversity Information Centre when defining biotopes in
Norway. For consistency, in Norwegian we refer to these biotopes as
“nature types”.
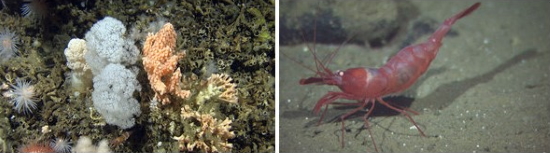
Bythocaris leucopis shrimp is common down to depths
of 2700 metres.
The species on the sea floor are not evenly
distributed: they appear in clusters associated with various
environments and sea floor types. Each combination of certain species
with a particular environment is known as a biotope, or “nature type”.
It is important to know how species are distributed if you want to
manage the sea floor as sustainably as possible.
However, as our
waters cover a vast area the process of mapping them is time-consuming
and expensive. So what is the best way of collecting information about
the biodiversity and biotopes in the large areas that need to be mapped?
Currently, the only available detailed information about the
compositions of sediments and benthic communities covers small areas
dotted around the map. The question is therefore: how do we go from this
situation to producing information covering the whole area? There are
two main options for this:
- Establish map points (“stations”) that are
close enough together to provide virtually continuous information about
the areas being mapped, or
- Leave larger distances between the stations
and then use detailed information about the environment to predict – or
to computer model – what biotopes you would expect to find between the
stations.
The disadvantage with the first option is that it is
expensive to map so many points close together. It is also very
time-consuming to analyse either sediment samples taken from the sea
floor using a grab, benthic sled or trawl, or videos of the sea floor.
The objection to the second option is that we know too little about the
relationship between the species and their habitats to allow us to make
reliable predictions about the areas between stations. It has proved
difficult to predict the distribution of species solely based on
information about the surrounding environment.
In general, a variety
of environmental factors combines in unknown ways, while biological
conditions simultaneously “disturb” the known factors. One of key
theories of the MAREANO project is that biological communities, which
consist of numerous species, are more stable in relation to
environmental variation than individual species. Whole communities can
therefore be predicted more reliably than any individual species.
When
describing biotopes, it makes sense to start by looking at the
environmental conditions, and that is exactly what the bathymetric maps
allow us to do. Those conditions are what determine which species can
live in an area, and thus what the biotope is. The climatic,
hydrological, topographic and geological conditions are the key
parameters here. Next, in order to classify a biotope, you need to take
into account the species living in the area, which together constitute
the benthic community.
Videos of the sea floor are analysed in order
to compare and classify different areas, based on the composition of
benthic fauna observed. It turns out that these categories also share
many characteristics in terms of water depth, acoustic reflection
properties, topography and other indicators obtained from multi-beam
echo sounding. In MAREANO they have used the correlation between these
data sets to predict what biotopes you are likely to find in other
similar areas, including places for which we do not have video
recordings (i.e. between stations).
2.4.1 Environmental chemistry
and pollution
The seabed receives contaminants from the environment, and
sediments become a significant storage place for pollutants. Sediments
can therefore be a source of pollution in the fjords and of the uptake
of contaminants by biota.
Such contaminants may be heavy metals, organic
compounds such as PAH or PCB, or radioactive compounds. Many of these
compounds, however, are also found naturally in the ocean, sometimes in
relatively high concentrations. For this reason, one has to know the
background levels for the region before one may expose a contamination,
and an important part of the environmental chemical studies is surveying
the natural levels of contaminants in areas that are not polluted.
2.5
Testing Autonomous Mapping
New sensor platforms, such as autonomous
vehicles and drones, open up new possibilities for mapping the terrain,
sediments and habitats in shallow waters and the foreshore. MAREANO has
teamed up with Norwegian University of Science and Technology to test
out unmanned and autonomous platforms for interdisciplinary mapping.
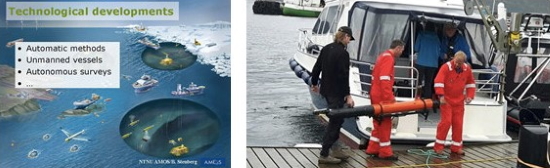
AUTONOMOUS UNDERWATER VEHICLE: The AUV "Harald" is prepared for
the expedition of the day and taken on board the boat "Lophelia". Photo:
Sten-Richard Birkely
During the mapping expedition a variety of
platforms both on, under and over the water, were tested, as well as a
range of different scientific equipment and sensors. The MAREANO
programme is particularly interested in the testing of video systems and
multibeam echo sounder on various platforms.
3. KNOWLEDGE FOR THE BLUE ECONOMY
The Norwegian seabed-mapping program is a
provider of knowledge for blue growth. MAREANO, provide scientific
information on what the Norwegian seabed looks like, its geology,
chemistry, and the biological communities that inhabit it. This
information, including how anthropogenic processes affect the seabed
environment, is needed for the sustainable management of Norway’s large
marine territory.
Turning aspiration into opportunity as dependence on
the oceans increases, to provide food, energy and ecosystem services for
a growing population. The Blue Growth faces unprecedented increase, and
should at the same time secure sustainable ecosystems and biodiversity
Commercial interest in ocean resources is rapidly expanding, including
oil and gas production, fisheries, blue biotechnology and mining.
Development of a blue growth should be based on the best knowledge of
pelagic and demersal habitats and ecosystems for sustainable commercial
activities in the ocean
MAREANO maps the seabed, presenting knowledge
on
- Habitats –geological and biological
composition
- Nature types –terrain variability
and seascape
- Environmental status in bottom
sediments
- Detailed bathymetry
- Database-and map services presenting
systematic information about the seas
These data and products are
important knowledge for fishery, navigation, energy, oil and industry,
mining, aquaculture, tourism and recreation, transport, constructions
and infrastructure.
One example of value is from the fisheries that
have tested active use of new seabed maps from Mareano and depth
data.The experiences so far is very good. The maps can contribute to
more precise, environment friendly and efficient fishery. The capture
has increased, the use of fuel is decreased and the damage on equipment
is reduced. Experiences from Canada also shows great economic and
environmental benefits by use of detailed depth data and bottom type
maps during fisheries. Now we have the same experience in Norway.
The
MAREANO programme can contribute to;
“Increase scientific knowledge,
develop research capacity and transfer marine technology, taking into
account the Intergovernmental Oceanographic Commission Criteria and
Guidelines on the Transfer of Marine Technology, in order to improve
ocean health and to enhance the contribution of marine biodiversity to
the development of developing countries, in particular small island
developing States and least developed countries.”
Sustainable
Development Goals, 14.a
There are still major deficiencies in the
basic knowledge of ocean biodiversity, ecosystem functioning, resilience
and connectivity. Increasing our fundamental knowledge of the ocean
systems is essential to underpin all societal, environmental and
economic activities in the ocean.
International cooperation gives
better maps and more value for money.
Recently there was a meeting in
Norway in a network (MIM) of the three largest marine mapping programmes
in Europe; MAREANO (Norway), INFOMAR (Ireland) og MAREMAP (Great
Britain), (MIM) will work for more standardised marine mapping across
country borders. There are many of the same challenges and problems in
all marine countries. In the network, they discuss methods, masterplans
for surveying, equipment for samples from the sea floor and mapping of
landforms.
To survey the seafloor has a cost of over 100 million NOK
every year. The knowledge are valuable and necessary to a good
management of the marine areas. In Norway, only 10% of the seafloor on
the continental shelf is surveyed so far. In these areas, we know a lot
about terrain, sediments, bottom types, fauna, biotopes and pollution.
This knowledge contributes to good management decisions. The nature does
not consider the country borders so that is why a core approach to
methods, classification and terminology will increase the value of the
surveying and the maps. It will simplify seamless maps and reuse of
knowledge to make other types of maps.
Other countries show interest
for the MIN cooperation and a handful of researcher from other countries
participates in some working groups. Researchers from Geoscience
Australia participate in the work of harmonising classification of
landscape and landforms. Other countries also participate in the work on
automation of map production. In the future, we hope that more countries
can make use of the same methods and terminology as- this will
contribute to a more objective and reusable surveying and mapping.
The
Mareano program is one part in Norway's efforts to get more knowledge
about the resources in the Ocean and the programme been presented both
to the World Bank, FAO and United Nation. We see the programme of
importance also as a contribution to the Ocean Economy. Last year our
Prime Minister Erna Solberg launched the Major intergovernmental Panel
on the New Ocean Economy. http://www.oceanpanel.org/
Reference:
The
Norwegian Sea Floor, New Knowledge from MAREANO for Ecosystem-Based
Management. ISBN 978-82-690163-0-7 Editors: Lene Buhl-Mortensen, Hanne
Hodnesdal and Terje Thorsnes The Mareano website:
http://www.mareano.no/en/a>
Biographical notes:
Educated surveyor with additional education in
architecture and law studies. Delegate to commission 3 since 2001 with
several publications, papers at congresses and WW. Editor of several
publications about Map and use of geospatial information. Leading
positions from municipalities, regional planning, Norwegian Mapping
Authority and now deputy director general at Ministry of Local
Government and Modernisation. Chaired exchange programme for young
surveyors between Vietnam, Laos and Norway 2001-2009. Worked with
Norwegian Agency for Development Cooperation.
Contacts:
Deputy Director General Kari Strande
Institution: Norwegian Ministry of Local Government and Modernisation
Akersgt. 59
Oslo
Norway
Tel. + 47 90996515
Web site: https://www.regjeringen.no/KMD


